



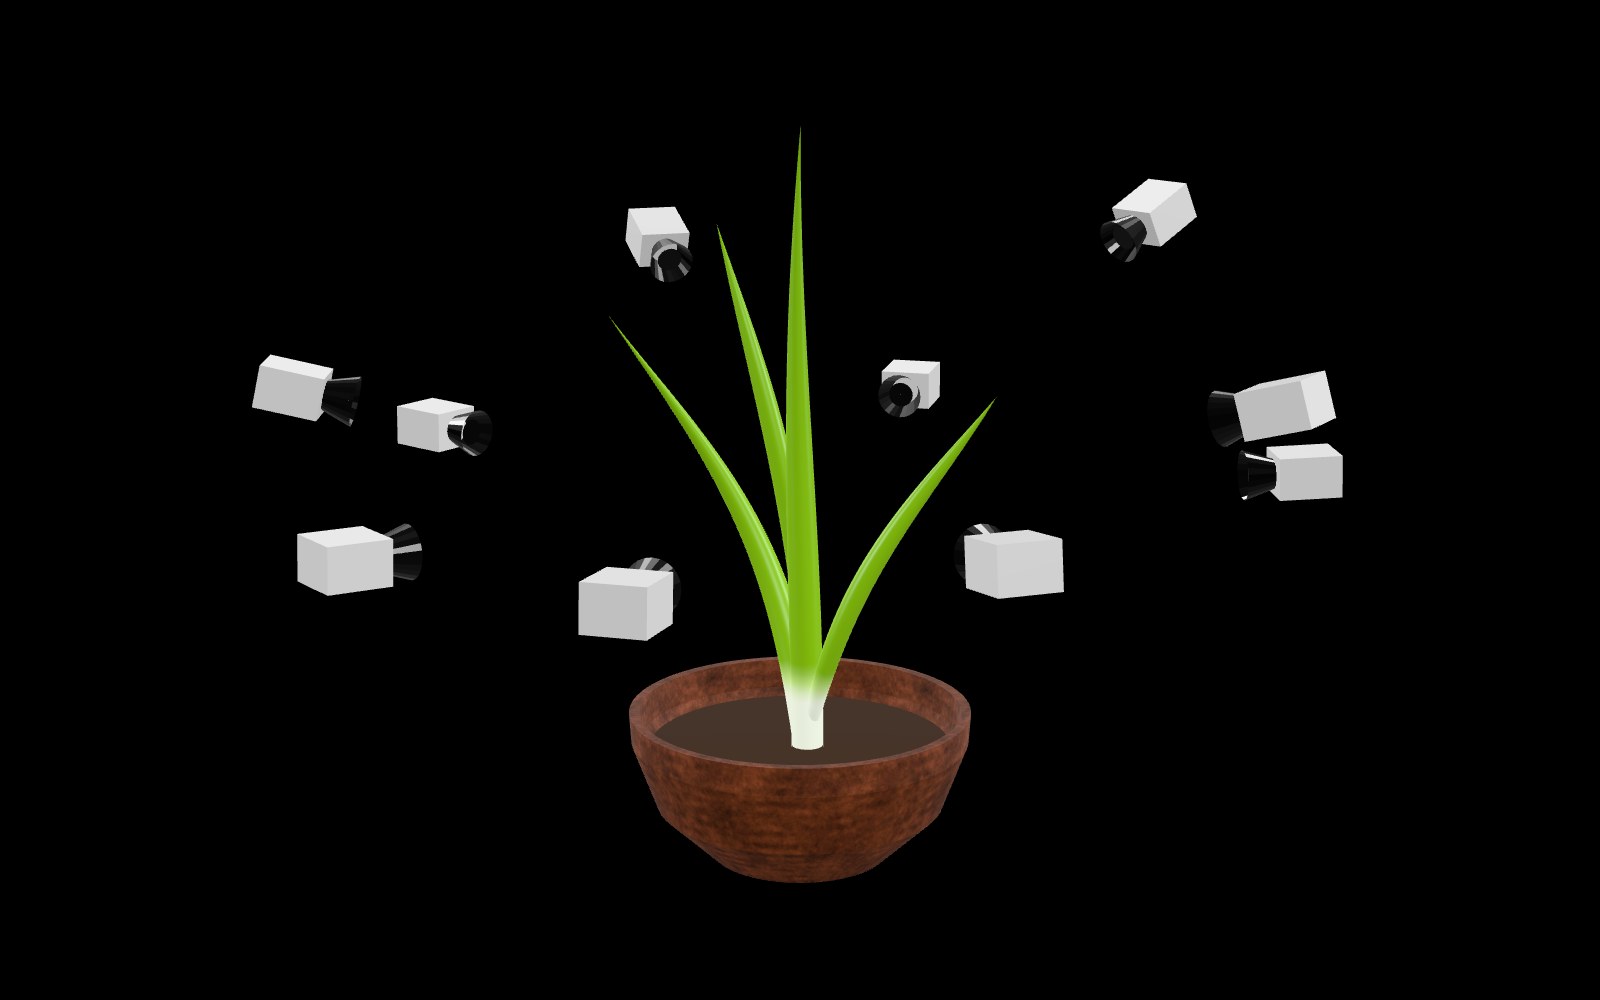
An animated spring onion grows inside the ten cameras that photograph it. Drag to look around.
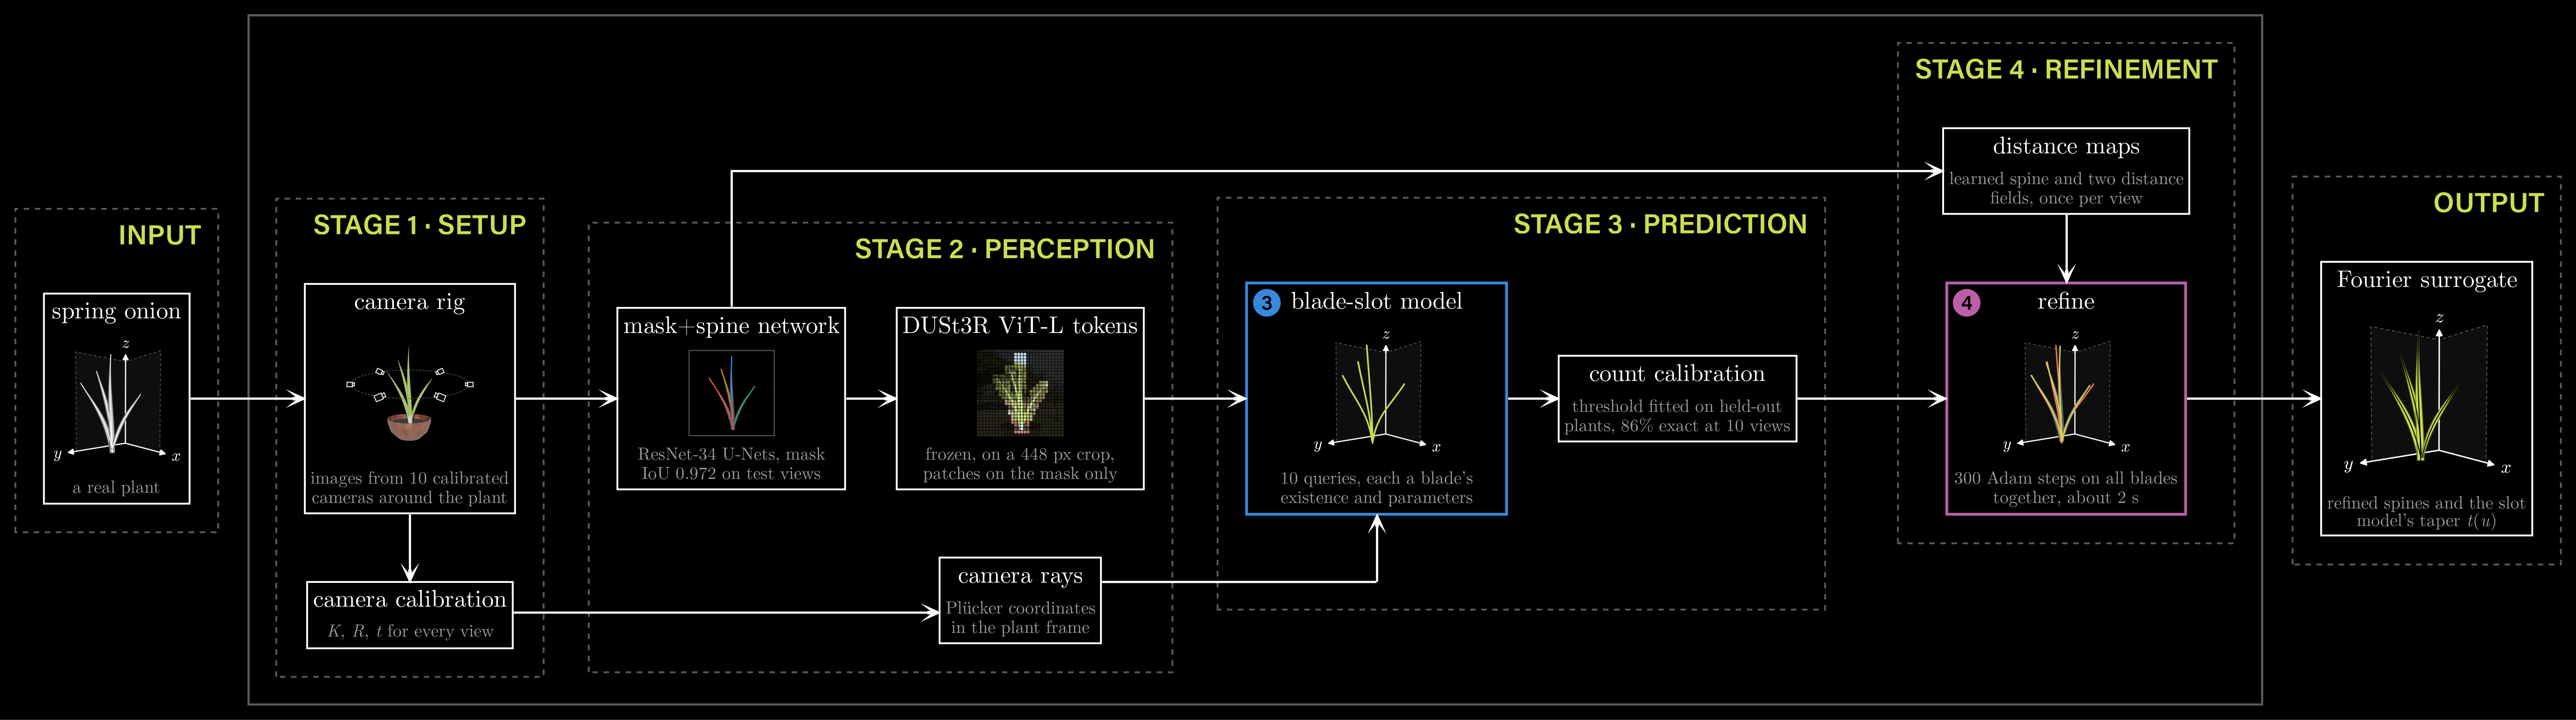
The pipeline, following one test onion from its photos to its Fourier surrogate. Numbers in the nodes are test-set results.
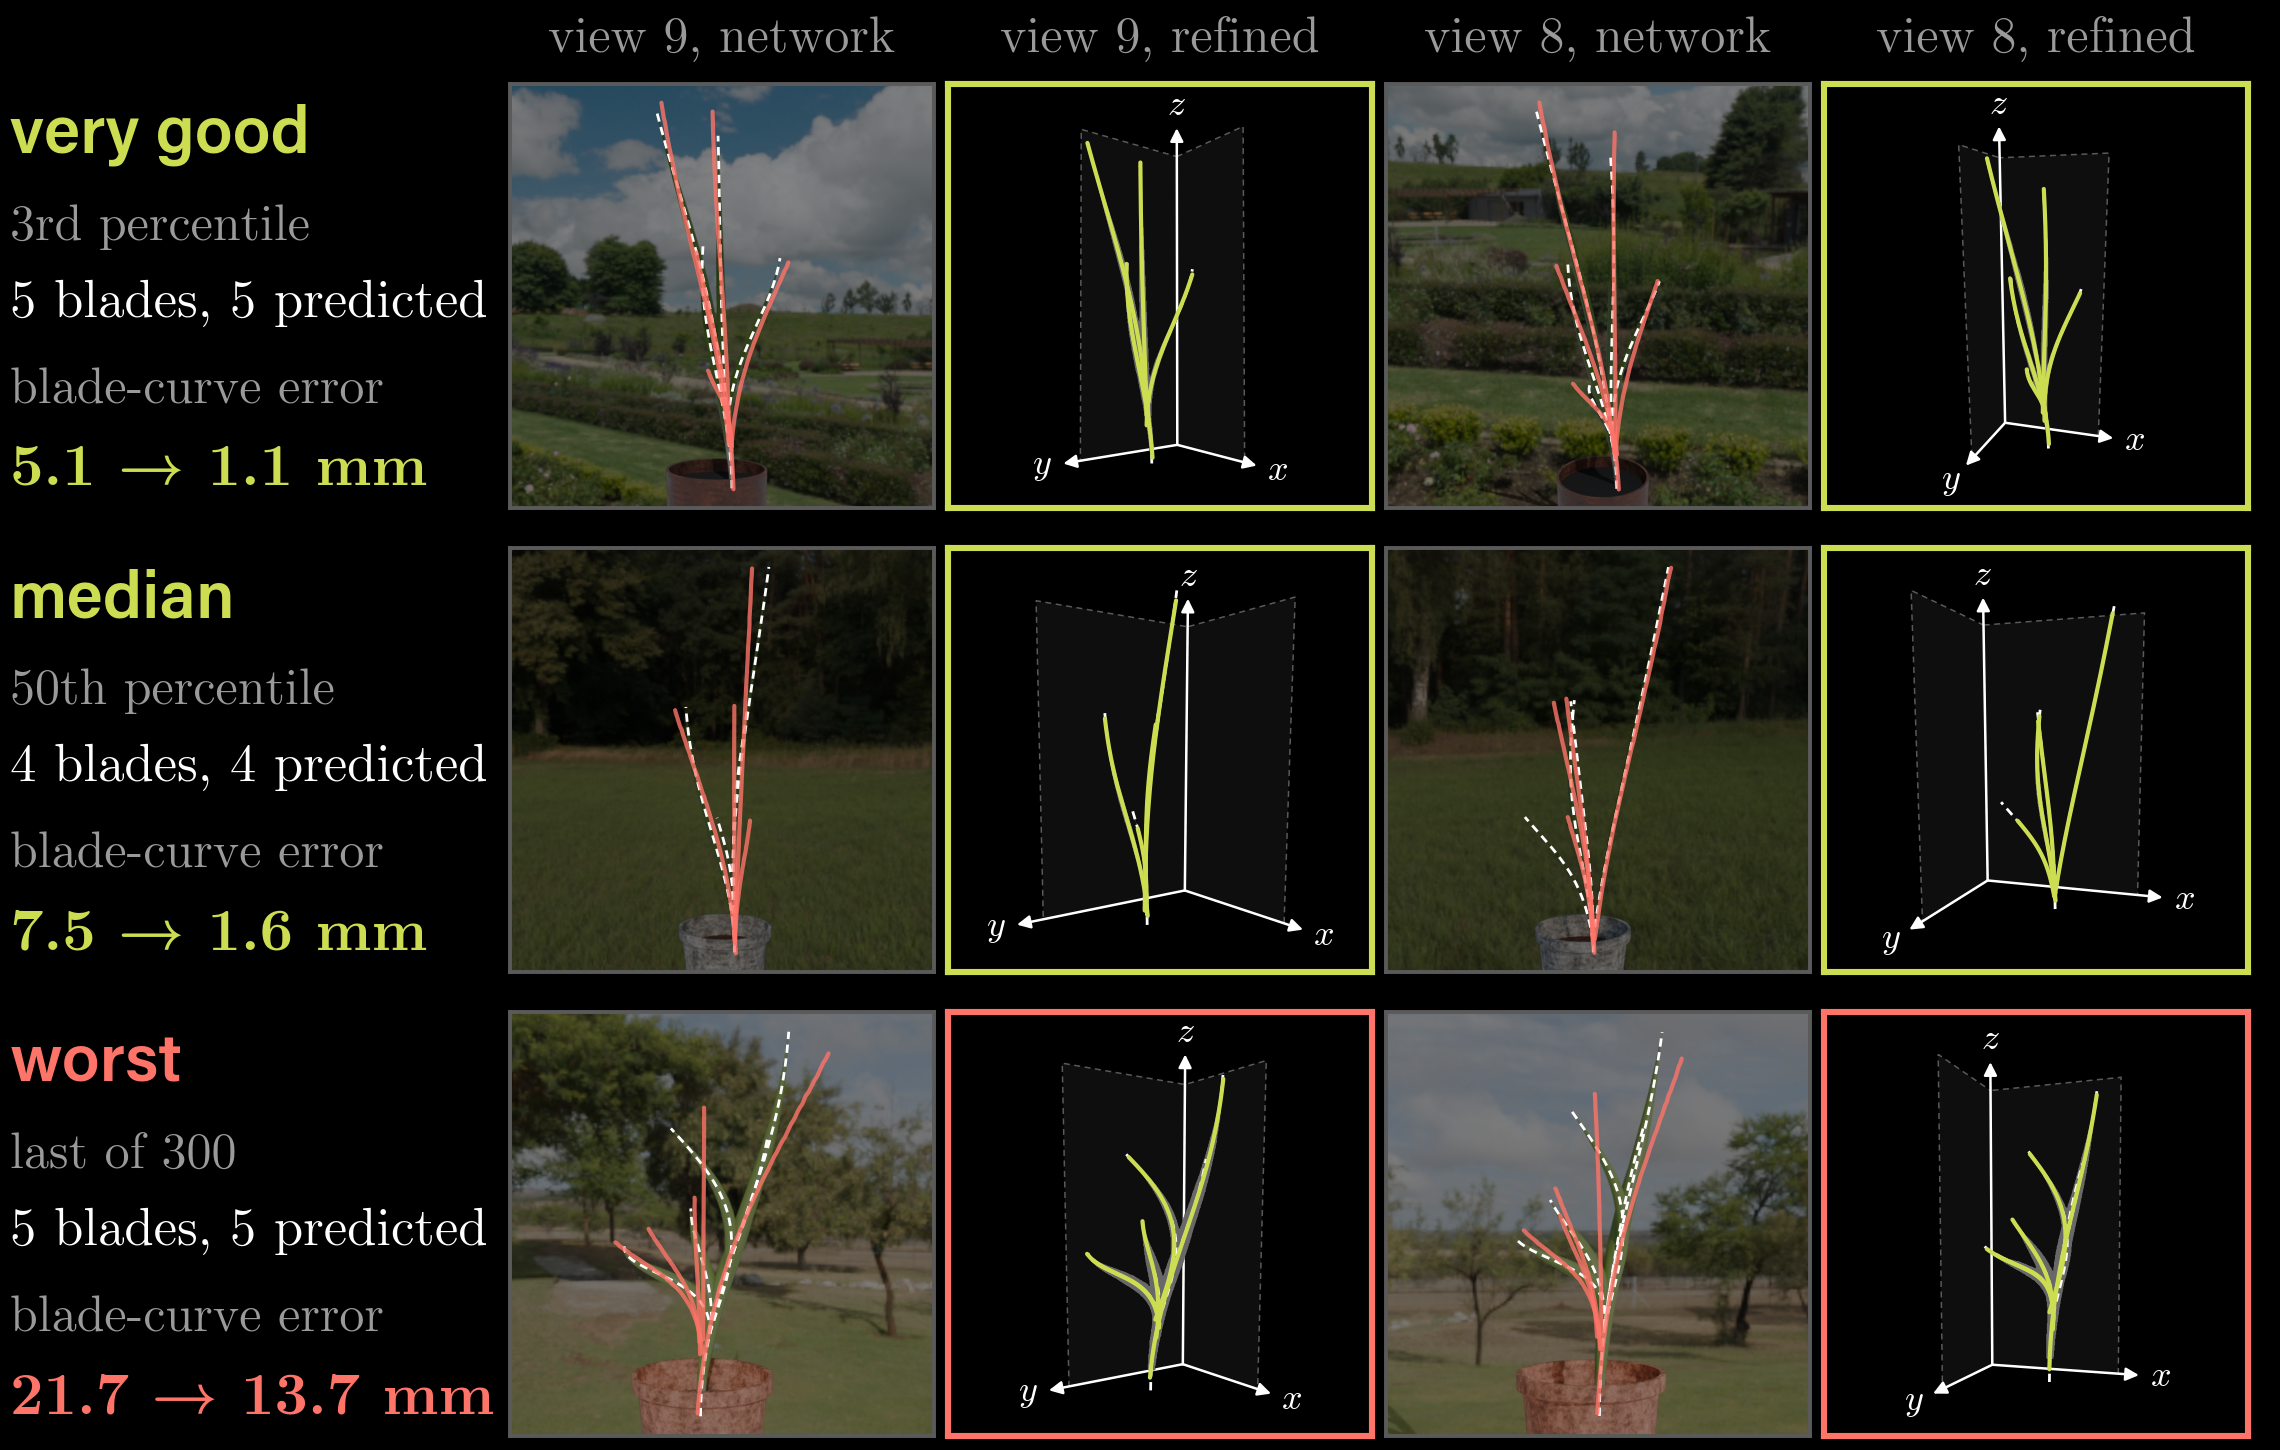
The slot model's spines over two photos (coral, truth dashed) and the refined spines in 3D (lime), for test onions ranked from the 3rd percentile to the worst of 300.
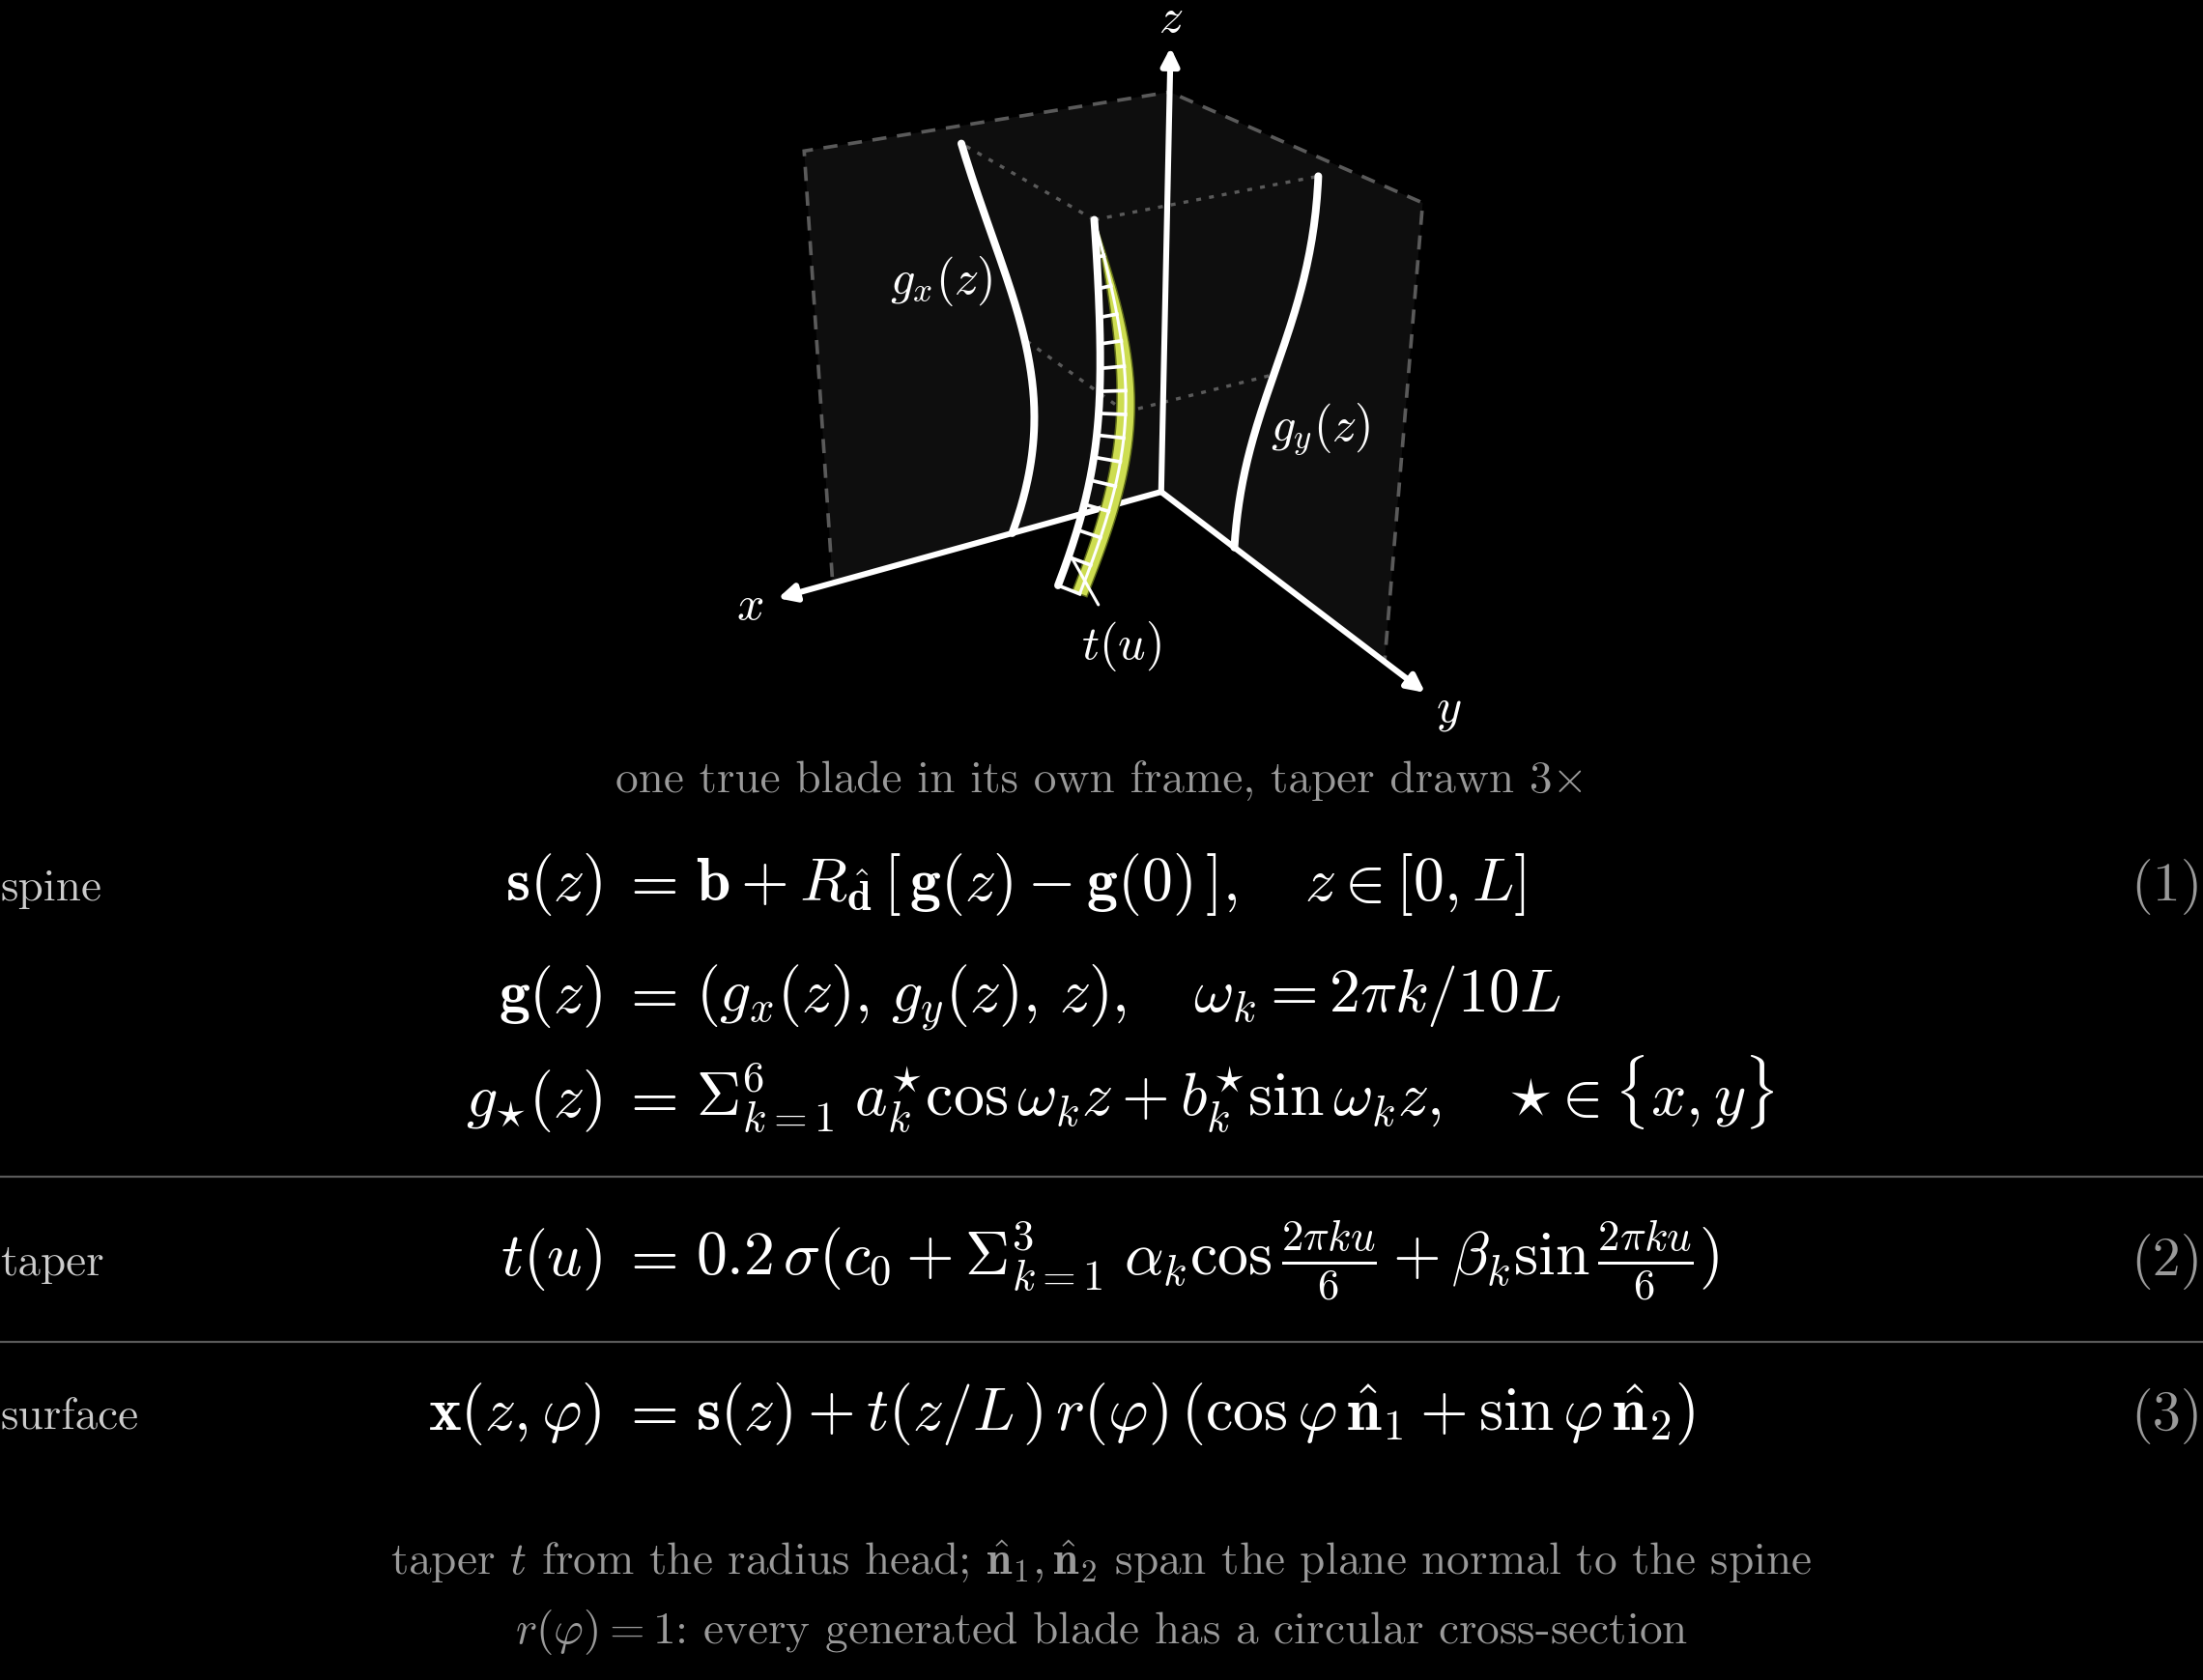
Each blade is a Fourier spine with a taper, the tapered tube that the onion generator draws.
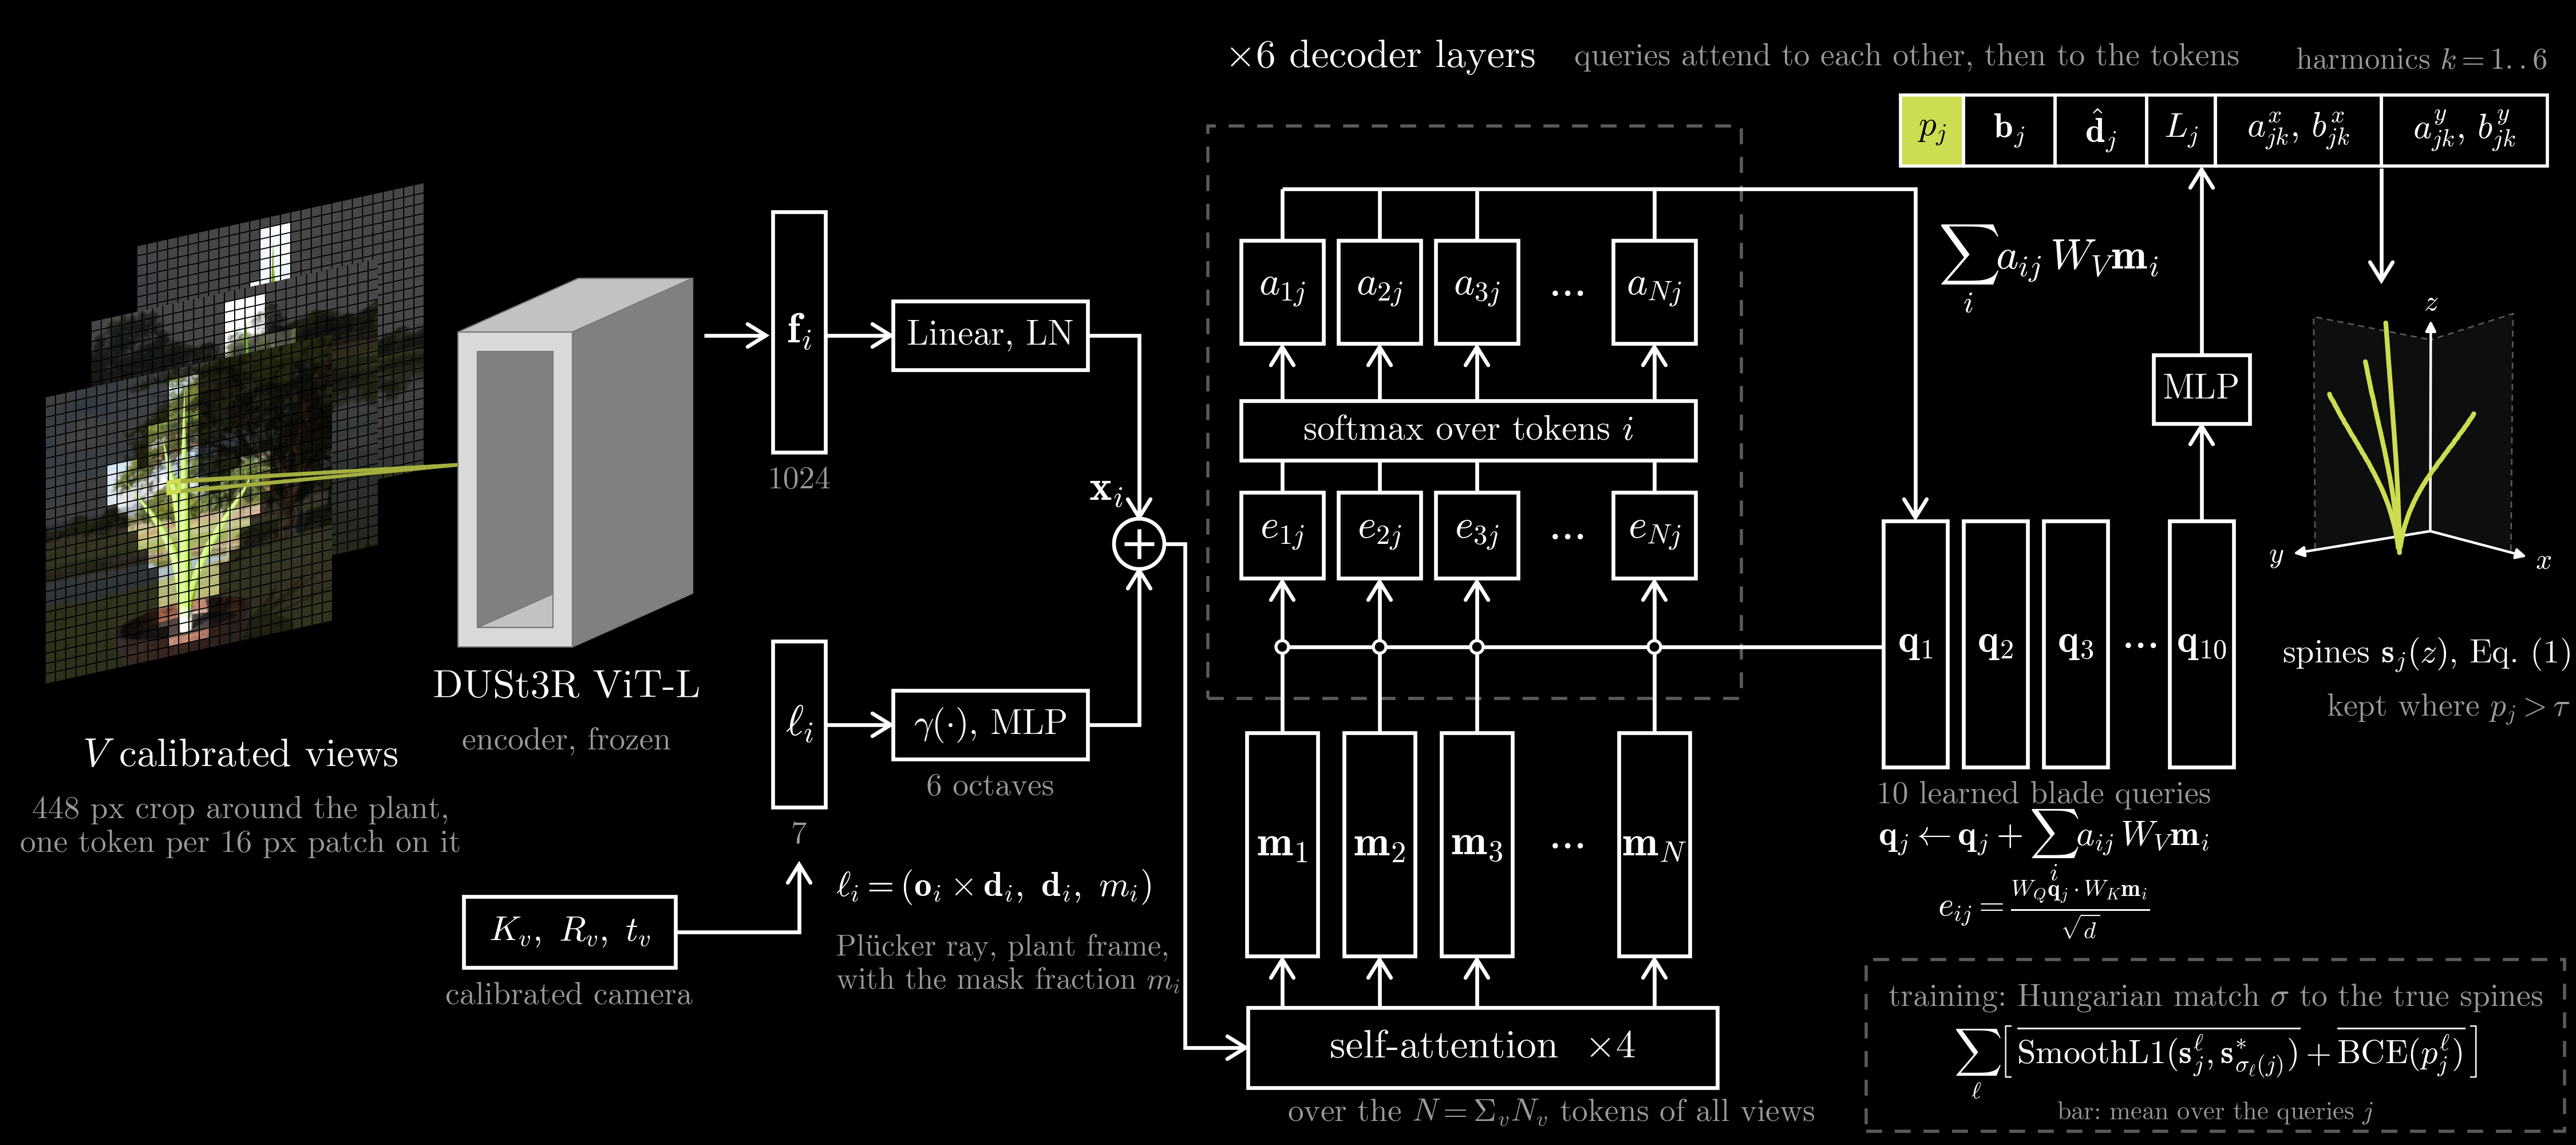
Stage 3, the blade-slot model: ten learned queries attend to frozen DUSt3R tokens from every view, and each decodes one blade.
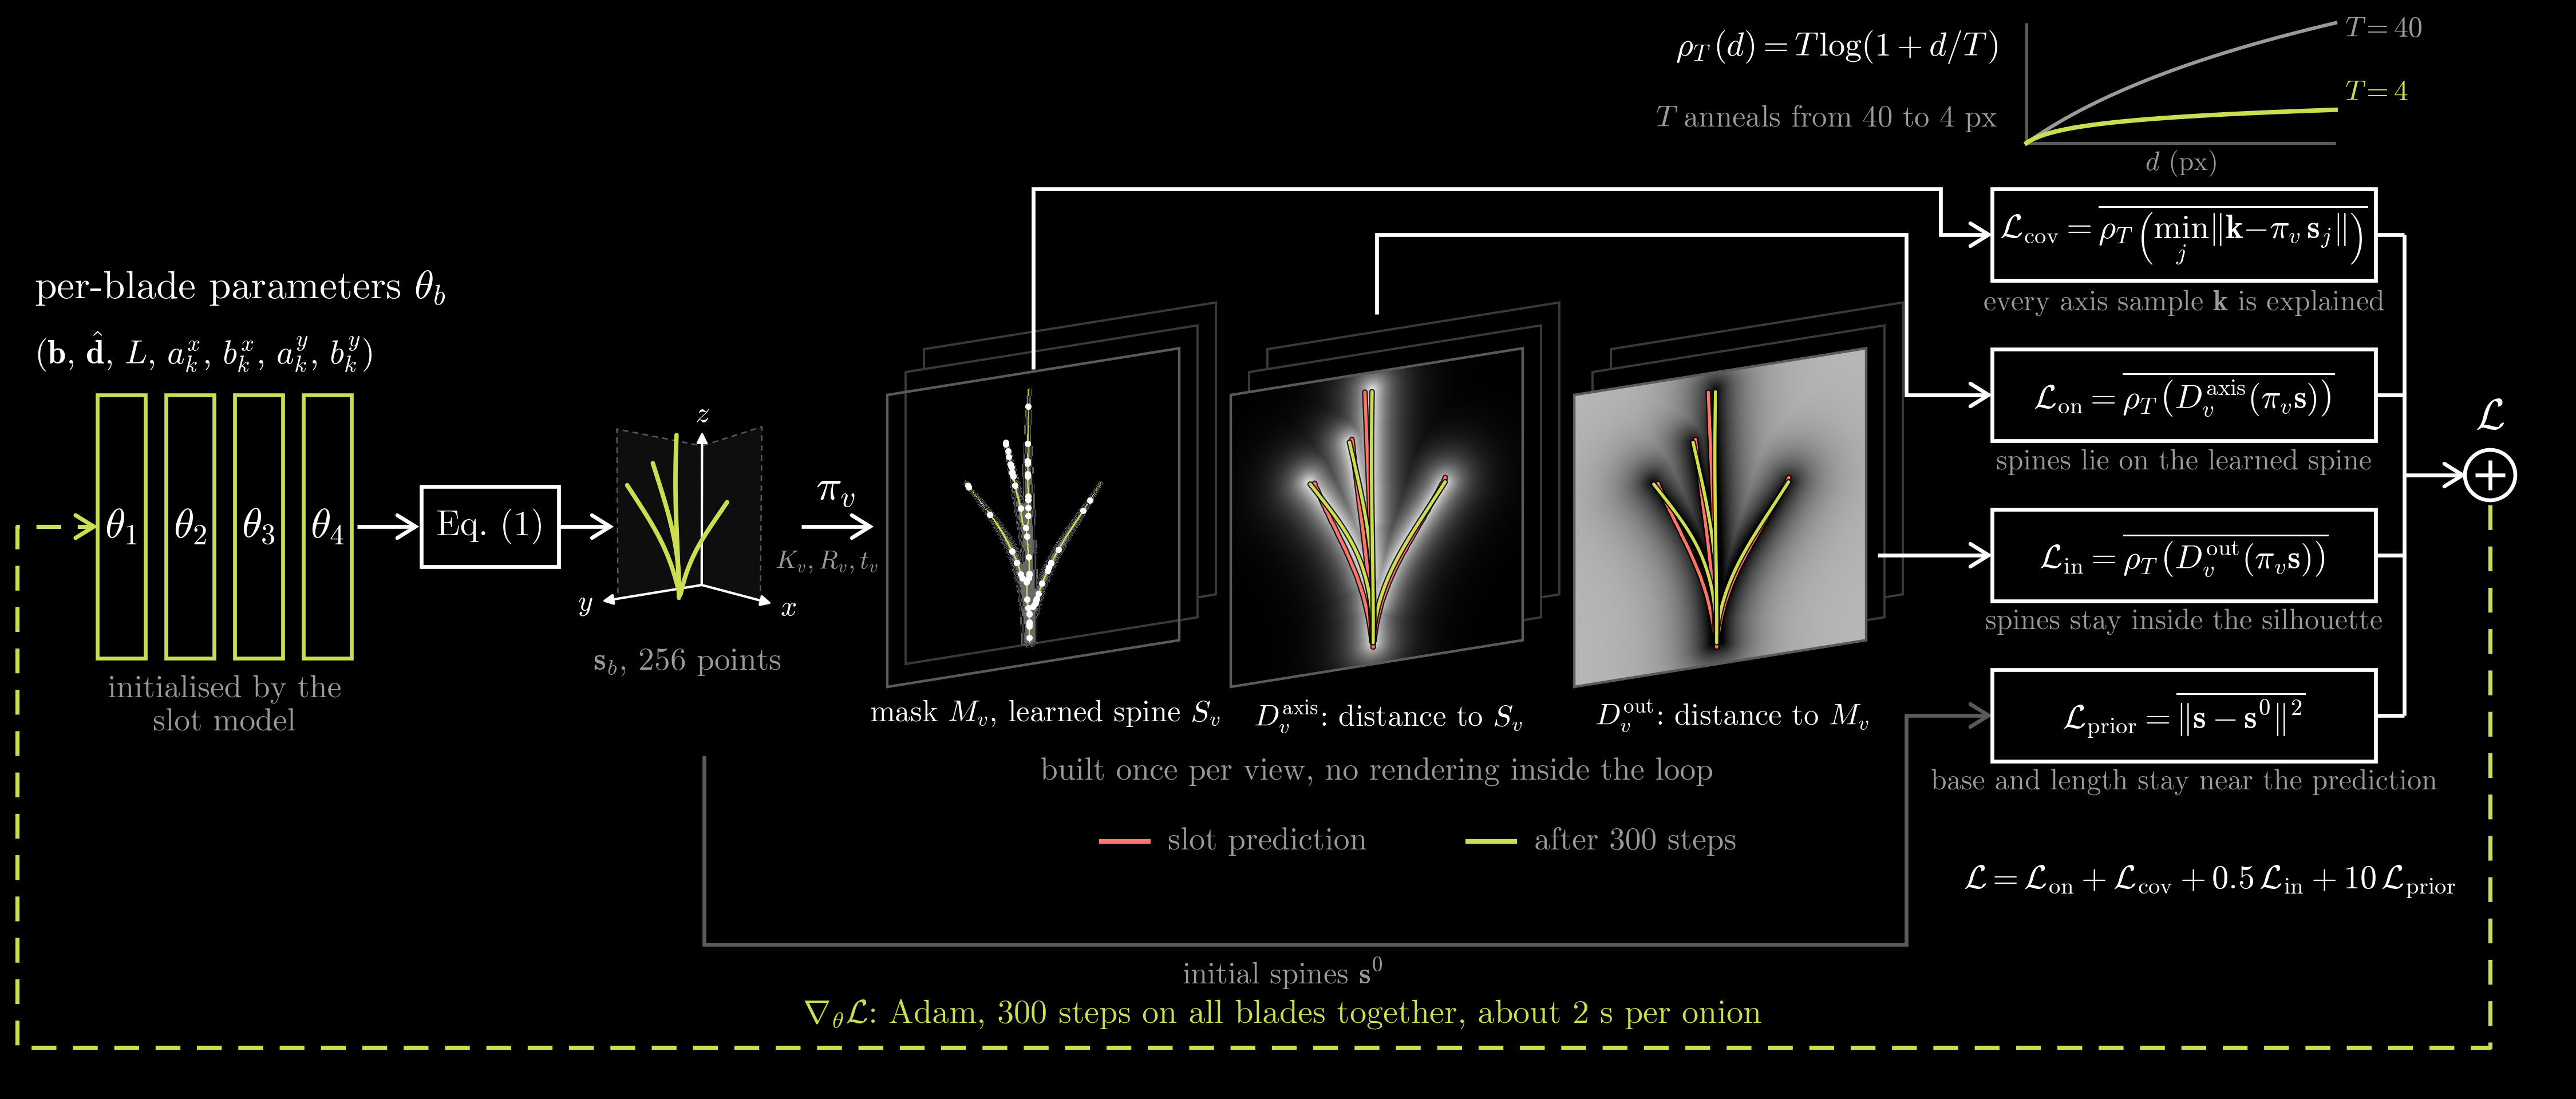
Stage 4, refinement: the predicted spines move onto distance maps of the learned spine and the silhouette, built once per view.
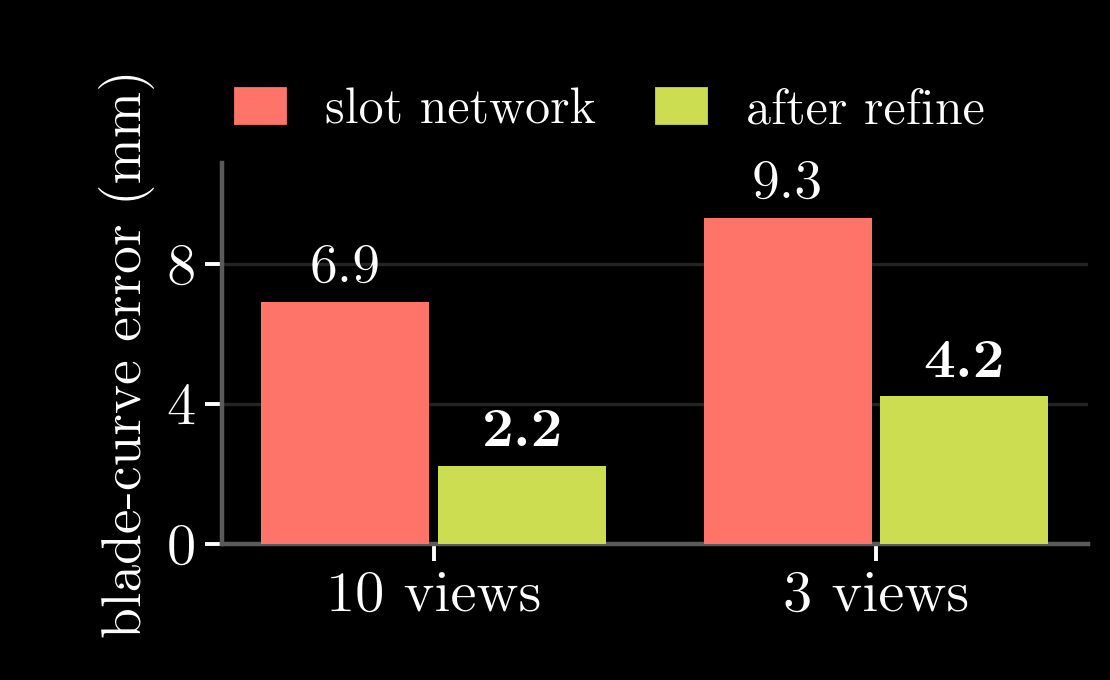
Refinement cuts the mean blade-curve error by 55 to 68%.
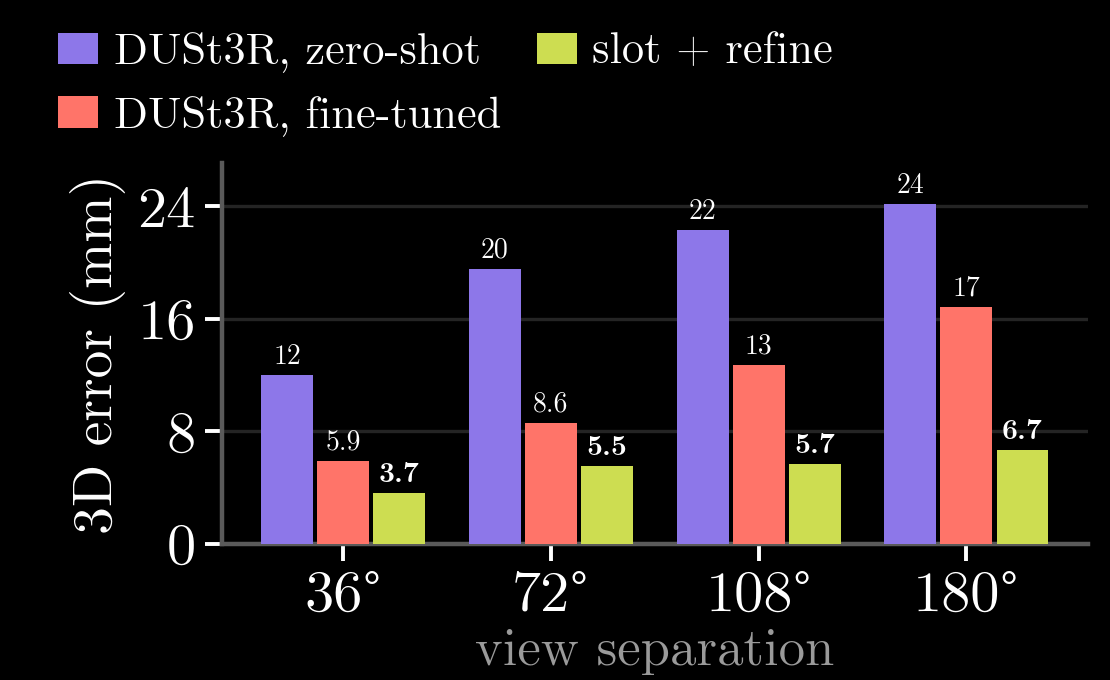
Per-pixel 3D error on pairs of views, 1.6 to 2.5 times below DUSt3R at every view separation.

Time per onion: 25 h for acquire, 3.2 s for slot + refine from 10 views.
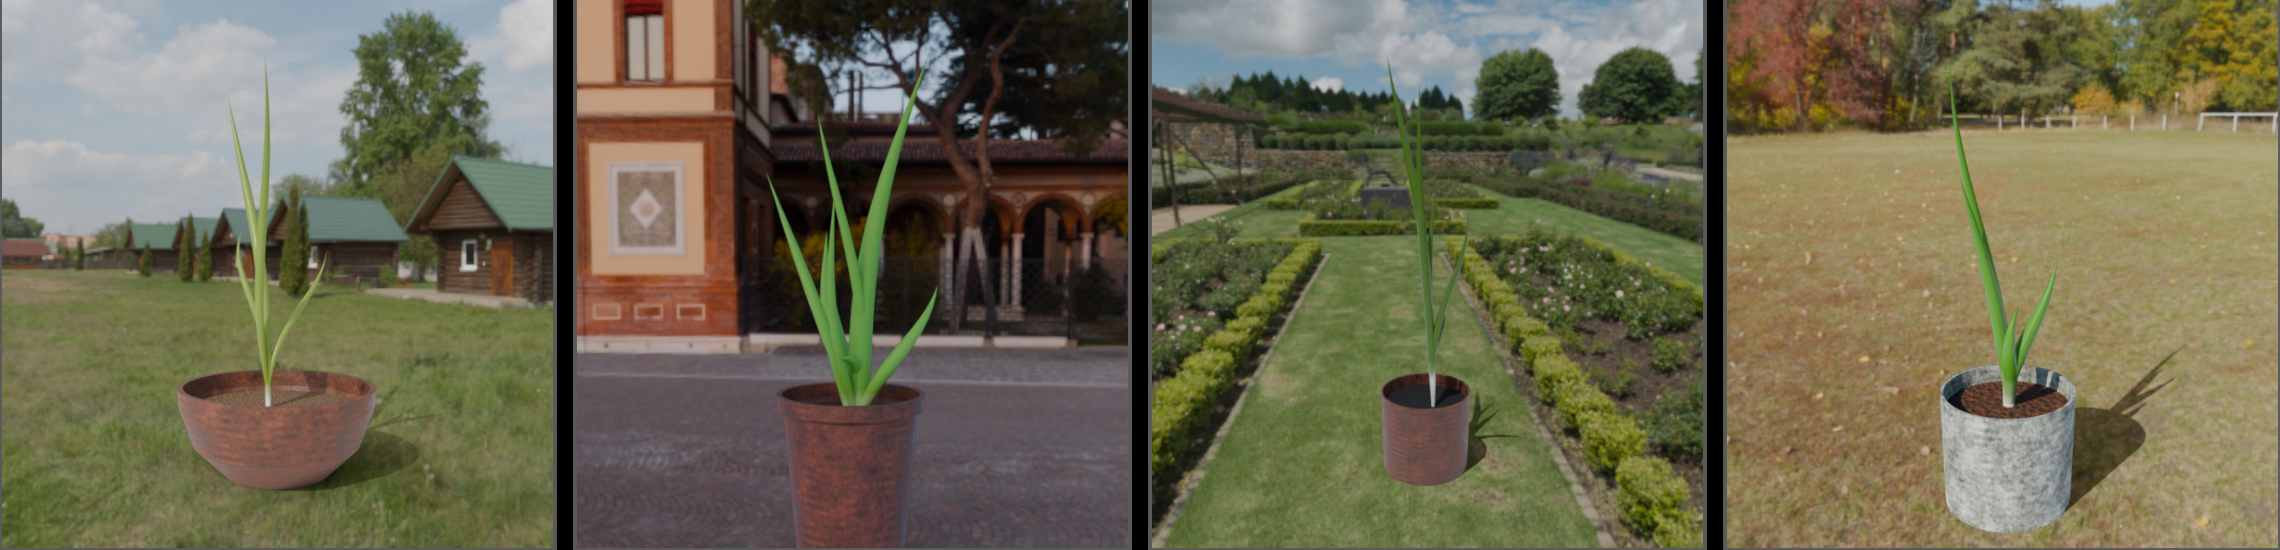
Generated onions rendered in Blender, each in its own pot and scene, for training and testing.
How quickly+easily+well can we measure an onion?
Capturing every blade of a spring onion in 3D from a few calibrated photos.
computationcomputer-visiongpumachine-learningmathmodeling
A plant's growth is a trajectory of 3D shapes, one for every day, and recording that trajectory for many plants needs a measurement quick enough to repeat daily and accurate enough to trust. Spring onions make a clean test case, since each plant is a handful of thin, curved blades. We photograph the onion with a few calibrated cameras instead of scanning it, and recover every blade as a Fourier surrogate: the Fourier-parameterized tapered tube that our onion generator draws, made of a spine curve and a taper that scales a circular cross-section along it.
In its own frame, a blade of length \(L\) has the spine$$\mathbf{s}(z)=\mathbf{b}+R_{\hat{\mathbf{d}}}\left[\mathbf{g}(z)-\mathbf{g}(0)\right],\qquad z\in[0,L],$$$$\mathbf{g}(z)=\big(g_x(z),\,g_y(z),\,z\big),\qquad g_\star(z)=\sum_{k=1}^{6}a^\star_k\cos\omega_k z+b^\star_k\sin\omega_k z,\qquad \omega_k=\frac{2\pi k}{10L},$$where \(\mathbf{b}\) is the blade's base and \(R_{\hat{\mathbf{d}}}\) turns the blade's own axis onto its initial direction \(\hat{\mathbf{d}}\).
The pure-optimization fit we started from, which we call acquire, fits one blade at a time to two silhouettes by Nelder–Mead and re-renders both views at every step. Recorded fits take 4.1 to 20.9 hours per blade, so an onion of 4.5 blades, the median, takes about 25 hours, which rules out measuring every plant every day.
Our pipeline replaces most of that search with a prediction, in four stages. Stage 1 calibrates the cameras once. In stage 2, a mask+spine network (two ResNet-34 U-Nets) finds the plant's pixels and its spine in each photo, and a frozen DUSt3ROpen paper ViT-L encoder turns the image patches on the plant into tokens, each carrying its camera ray in Plücker coordinates in the plant's frame. In stage 3, a blade-slot model, a cross-attention decoder in the style of DETROpen paper, lets ten learned queries attend to the tokens of every view, and each query decodes one blade's existence and its Fourier parameters; a count threshold fitted on held-out plants decides how many blades to keep.
Refinement, stage 4, keeps acquire's medial-axis fit but starts from the slot model's output. It builds two distance maps once per view, one to the learned spine and one to the silhouette, and moves all blades together for 300 Adam steps so that every projected spine lies on the learned spine, every learned-spine pixel is explained by some blade, every blade stays inside the silhouette, and each base and length stays near the prediction. Since nothing is rendered inside the loop, refinement takes about 2 s per onion.
We train and score on synthetic onions, since a generated plant comes with exact spines and camera poses. We render 5,700 generator plants in Blender, each from 10 calibrated views, and every result below is on 300 held-out onions, with errors in millimetres for an onion 30 cm tall.
From 10 views, the median test onion is off by 1.6 mm along its blades, 0.5% of its height, and the blade count is exact for 86% of onions (78% with 3 views). Refinement cuts the slot model's mean blade-curve error by 68% with 10 views and by 55% with 3. With blade thickness from the network, the full 3D surface of 150 test onions has a median depth error of 0.5 mm per pixel, and 97% of its pixels lie within 3.9 mm.
Against DUSt3R on pairs of views of 100 test onions, scored with its own evaluation protocol, our per-pixel 3D error is 1.6 to 2.5 times lower at every view separation, although our pipeline is given the calibrated cameras and DUSt3R is not.
Counting and crowded plants remain the largest errors, and per-blade masks from the mask+spine network's blade embedding target both. Real photographs will also need the plant's frame, which we will take from the pot rim.
The whole pipeline takes 3.2 s per onion with 10 views, or 1.8 s with 3, on one RTX PRO 6000 GPU, against about a day for acquire, so measuring every plant every day becomes practical.
This work is funded by a Haythornthwaite Foundation Research Initiation Grant.
Spying Simulator
Combat Stealth Search
codecomputationcudagpumathmodelingsimulationspatial-modeling
Delve into the intricate strategies of spies and enemies navigating the virtual landscape of the "Spying Simulator." The core of this project lies in developing a small combat-spying simulator driven by an agent-based probabilistic model. Tasked with uncovering hidden enemies in a topographical environment, a series of agents embark on a meticulously crafted recognizance military mission. The simulation is implemented using Python and Julia, seamlessly integrating mathematical intricacies and fulfilling visualization requirements.
The code initiates with a point-based landscape generated using the function described in Draggy and randomly placed bushes on top to simulate a natural terrain. Precision in slope determination is achieved through a finite-difference approach with a radius-2 neighborhood approach. What's the math behind this, you ask? Combine:$$C(h)=\frac{f(x+h)-f(x-h)}{2 h} = f'(x)+\frac{1}{6} h^2 f^{(3)}(x)+O\left(h^4\right)$$with:$$D(h)=\frac{f(x+2h)-f(x-2 h)}{4 h}=f'(x)+\frac{2}{3} h^2 f^{(3)}(x)+O\left(h^4\right)$$like so:$$\frac{1}{3} \displaystyle\left[4\cdot C(h)-D(h)\right]=f'(x)-\frac{1}{30} h^4 f^{(5)}(x)+O\left(h^5\right),$$and you get a slope that is accurate to the fourth order. The usage of GPU for the creation of the environment is a key feature of this project. CUDA is used to create a 3D environment with a high level of detail, and to render the environment in real time. This allows for a more immersive experience, and helps to create a more realistic and engaging simulation.
Let's begin with enemies: Enemies navigate with a blend of simulated annealing and randomized algorithms. Their objective: ascend strategically to gain altitude since it is a gain in tactical advantage. A team-centric algorithm ensures that two enemy allies do not approach each other since this increases the risk of being found by agents. Essentially, the enemies perform a global maximization in the topography "domain."
Meanwhile, a dual strategy unfolds based on enemy visibility on the agent's front. Without enemies in view, agents engage in a random walk, meandering through the landscape devoid of immediate threats. However, a tactical ballet takes center stage when enemies appear within the view distance. Agents position themselves within bushes to avoid being seen and execute a hopping strategy. They hop to gauge the enemy's size and proximity in sight.
Crucially, the project employs a nuanced probabilistic approach to discovery, injecting a dose of realism into the simulations. The incorporation of detailed topological features elevates the complexity of the virtual battlefield. Experimental results illuminate not just the speed but also the efficiency of the search models, particularly in navigating complex environments. Beyond its military application, the project holds promise for search-and-rescue missions, where the swift and effective discovery of unknown targets takes precedence.
My contribution to this project was the development of the environment, the slope determination algorithm, enemy navigation algorithm, and the implementation of the GPU. I also helped with integration of python-based agent code with the Julia-based environment.
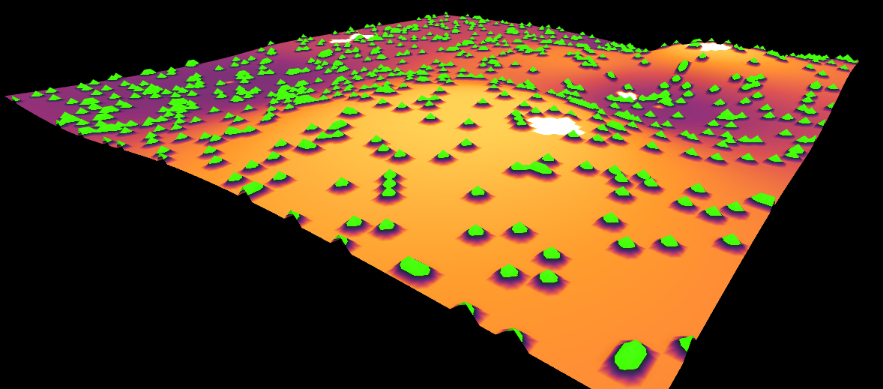
Generated Topographical Environment with Bushes (green)
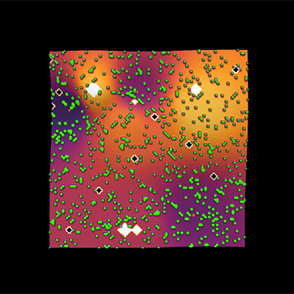
Environment with Agents (black) and Enemies (white)
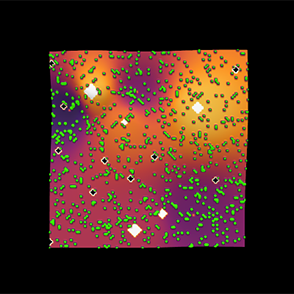
Scenario at time = 173 steps
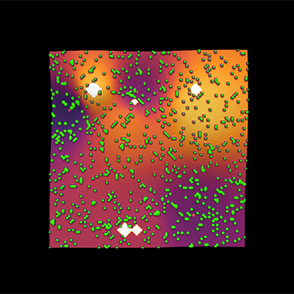
Topographical Environment with Bushes and Enemies
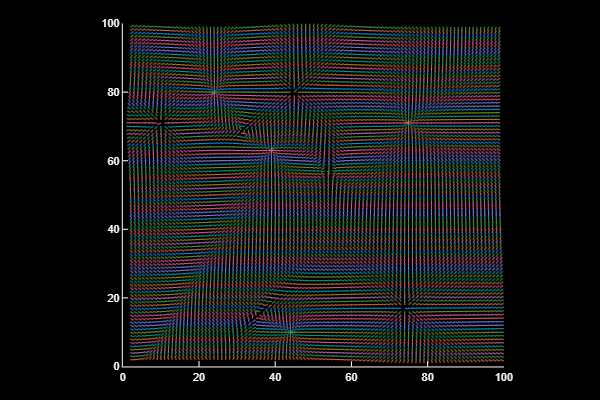
Vector Flow of Slopes at Each Point
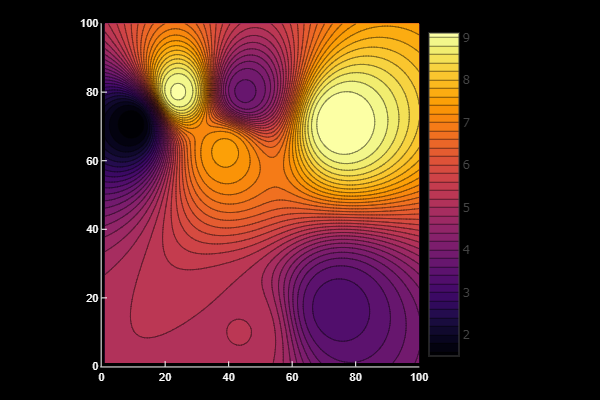
Contour Plot of Topography
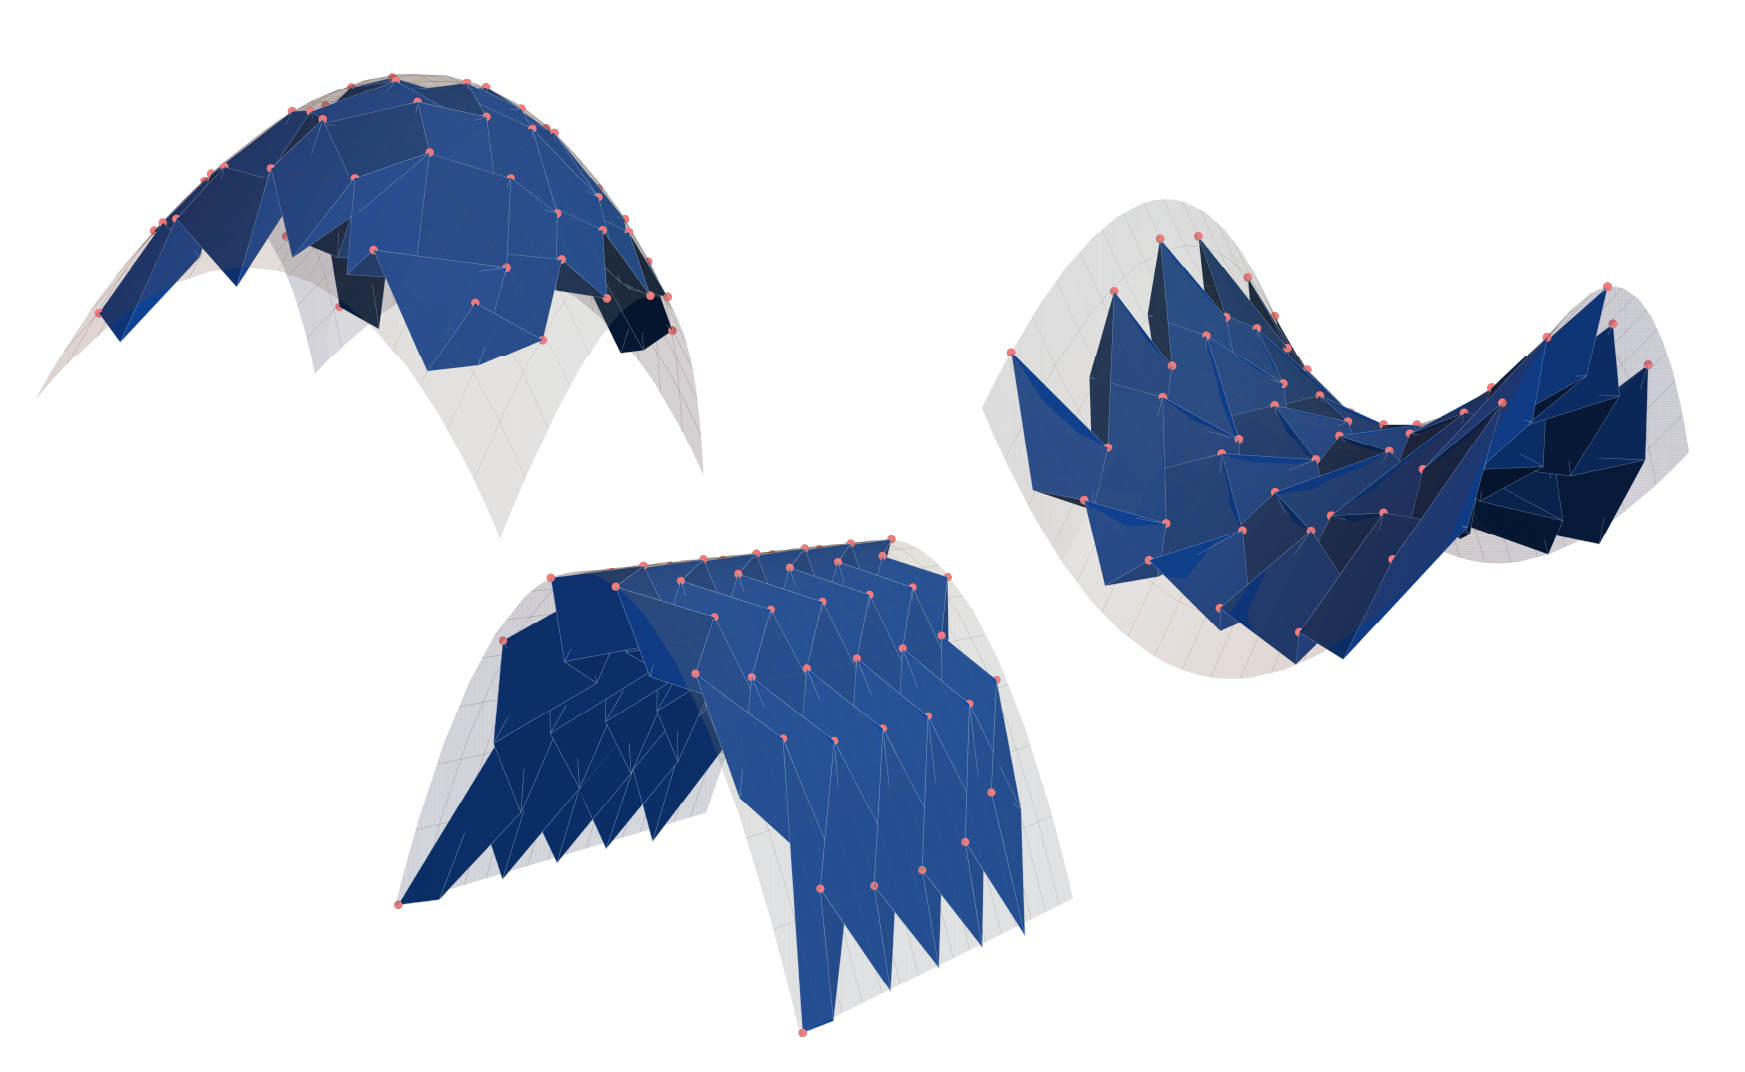
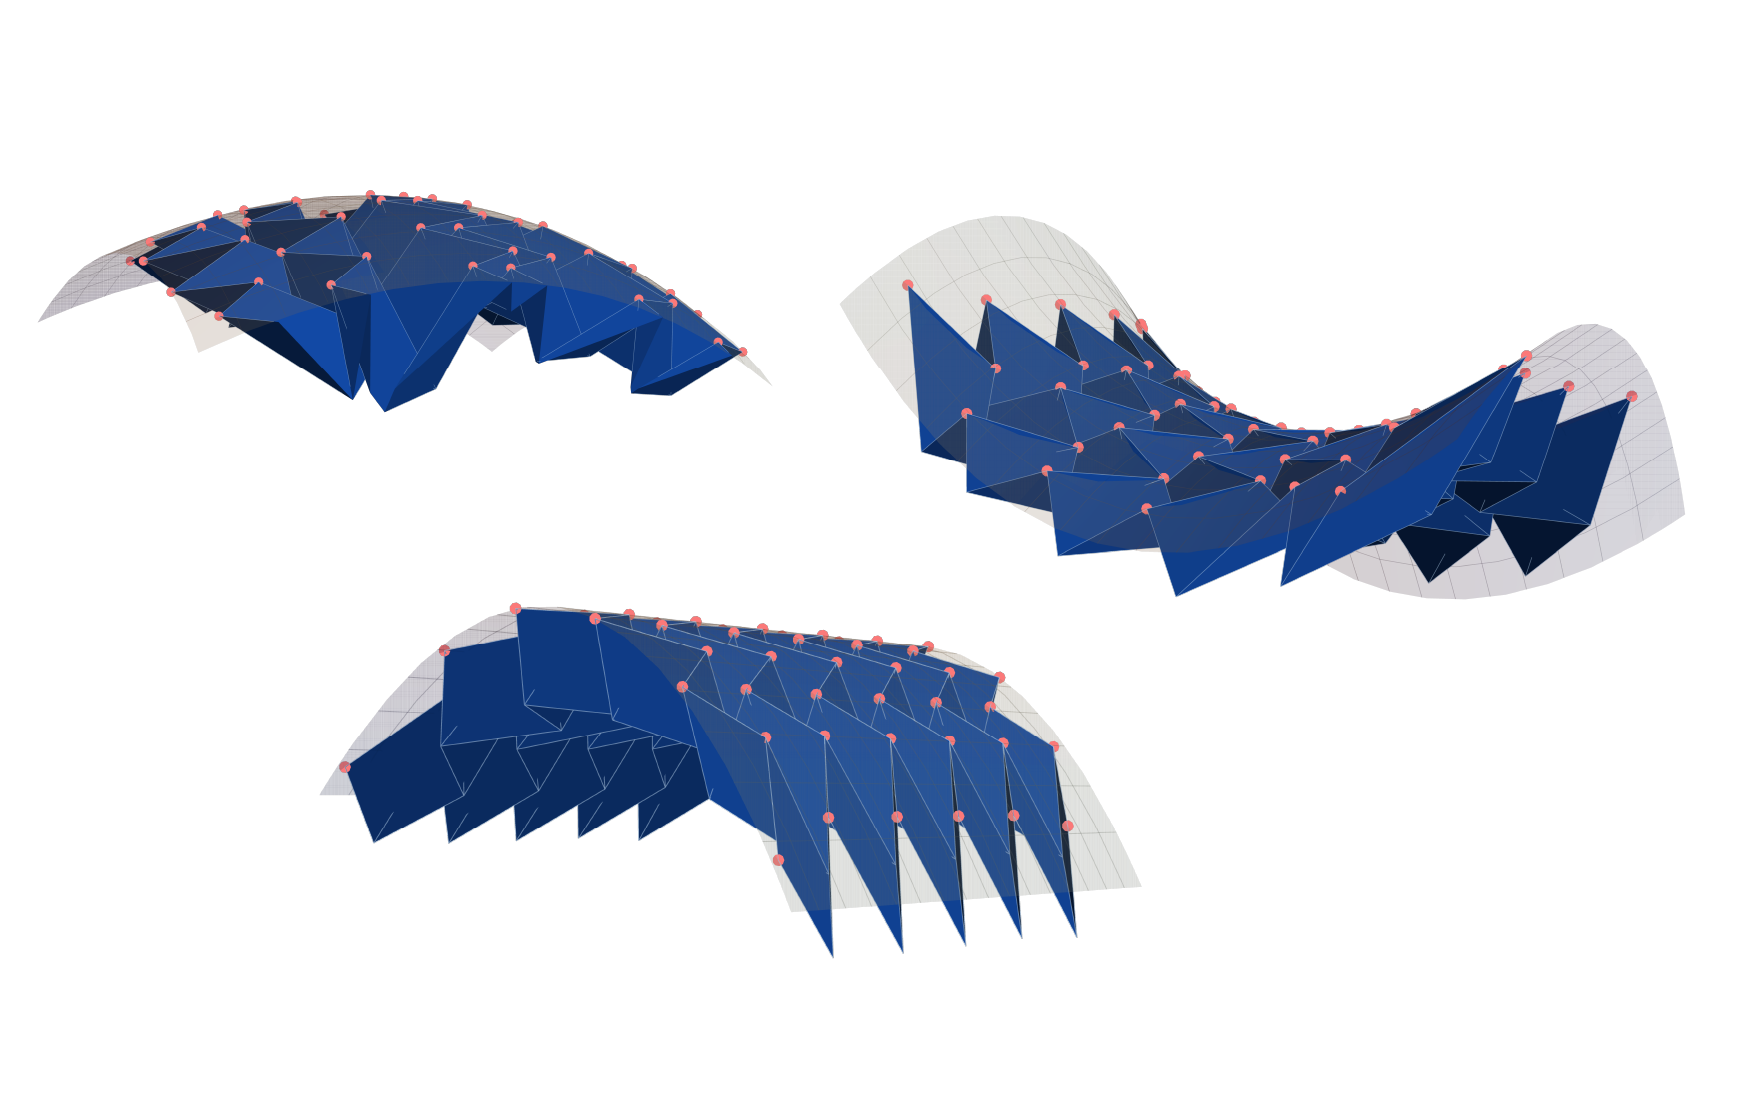
Results of Origami algorithm that are compliant mechanisms.
Results of Origami algorithm that are rigidly foldable.
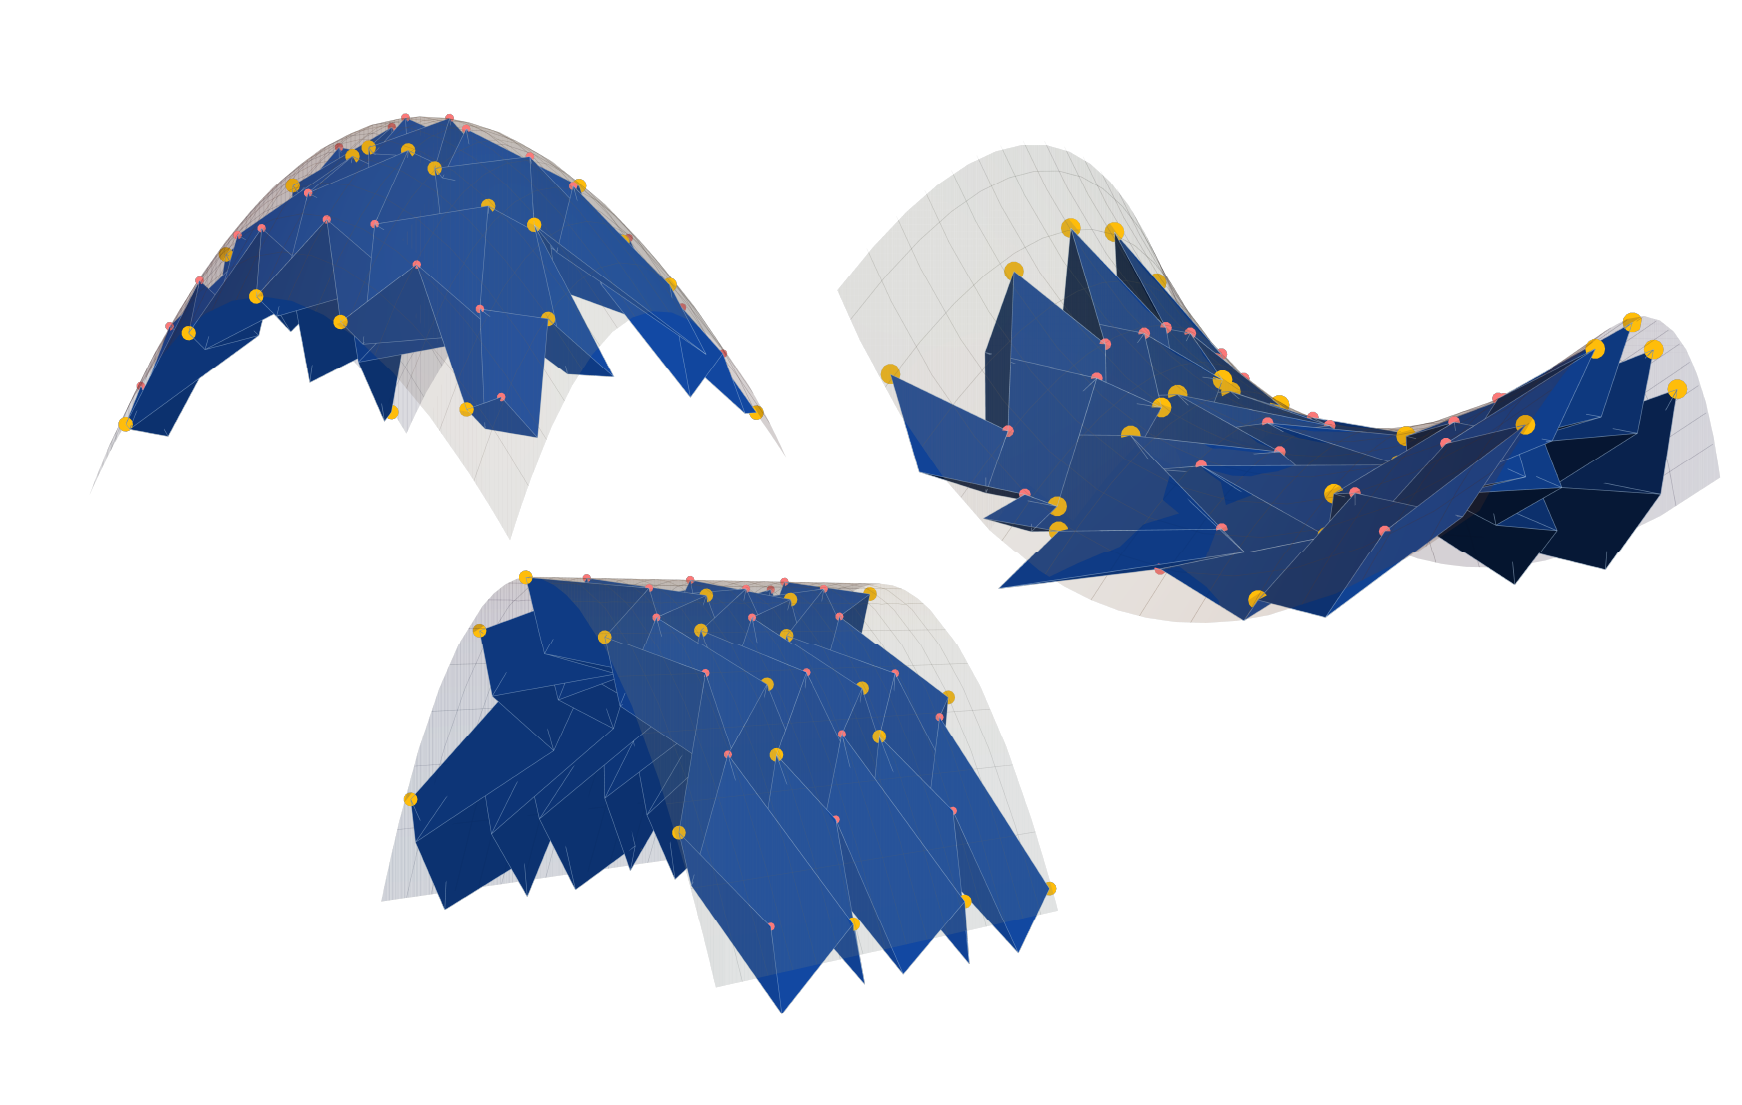
Results of Origami algorithm that allow minor deviations from design forms at yellow vertices.
Computational Origami Design
Quad-Origami "Miura-like" Tesselations that Rigidly Fold into Arbitrary Design Forms
architectureartcodecomputationmathorigami
This project involves the development of a computational model for creating Miura-like origami tessellations that can be folded into arbitrary design surfaces. We use a modified version of the Levenberg-Marquardt algorithm to iteratively solve for the developability, flat-foldability, and planarity of the origami surfaces, which allows me to generate designs that are both aesthetically pleasing and functional.
One of the key advantages of using Miura patterns is that they have a single degree of freedom, and any tessellations of them can be controlled with just one actuator. This allows for structures to be continuously and smoothly changed between different configurations, making them incredibly versatile and having a wide range of potential applications. For example, they could be used to create deployable structures for architectural and engineering applications, or to design reconfigurable structures for use in space exploration. They could even be used as modifiable army training landscapes with controllable slopes and valleys.
One of the key challenges faced during the development of the model was dealing with the over-determined nature of the system of equations that govern the design of these surfaces. In order to make the system more tractable, "soft constraints" were introduced on the coordinates of the vertices, which ensured the solution remained Miura-like in both design and function while still allowing for a wide range of different designs to be produced.
Overall, the project has been a success, with the proposed model being able to generate a variety of different Gaussian curvatures that are rigidly foldable. The work represents a novel approach to the design of these structures, and has potential applications in a variety of fields including architecture and engineering.
This work was presented at the IASS Spatial Structures International Conference. Watch itOpen video link.
Generating developable and rigidly foldable origami surfaces with arbitrary Gaussian curvatures.Go to website
Proceedings of the International Conference on Spatial Structures 2020/21 (IASS2020/21-Surrey7), UK.
AMP Relax!
Architectural Design of a Student Activity Centre
architectureartdesign
The AMP, or Amphitheatre, is a building I designed for a studio course in architectural design. The building is characterized by its blob-like exterior, which is covered in glass and aluminium cladding in a parametric form and its box-in-a-box grammar. This creates a unique and striking visual appearance, and reveals certain parts of the interior to the exterior.
One of the key motivations behind the design of the AMP was to create a building that stood out from the orthogonal buildings that are typically found on academic campuses. By using a non-orthogonal form and incorporating elements like the parametric cladding, the building is able to break free from the constraints of traditional architectural design and create a more dynamic and engaging visual experience.
Another important design motivation for the AMP was the inclusion of an open-air amphitheatre at its core. This provides a central gathering space for students, and allows for social and cultural events to take place within the building. The amphitheatre is open to the exterior at the top, and is visible from all floors thanks to the use of glass curtain walls. This creates a strong visual and functional connection between the different levels of the building, and reinforces the idea of the amphitheatre as a unifying element.
In terms of the organization of the programs within the AMP, the building is designed to be more socially interactive at the lower levels, and less so at the higher levels. This is intended to create a natural flow and hierarchy within the building, and to encourage students to use the building as a place to gather and socialize. The ground floor features a bowling alley and skate park, as well as outdoor seating, while the first floor is home to a high-end restaurant with seating that opens to the amphitheatre. The second floor is a supermarket with a large open area for display racks.
The inclusion of outdoor seating on the ground floor is a way to make the building more accessible and inviting to students. It provides an inviting space for students to relax and socialize outside, while still being close to the other programs and amenities within the building. The book shelves along the giant stairs that lead to the first floor and the stairs themselves are designed to be used as seating, and help to create an open and spacious working area within the building.
The AMP also incorporates a range of other design elements that enhance its functionality and construction. For example, the placement of the toilets is designed to ensure that the MEP elements are in the same vertical, which simplifies construction and reduces the potential for failure. The back of the building features a backstage area, and the seating of the amphitheatre is supported by a foundation that is located below the seating. The service elevator opens to the back of the building and serves the restaurant kitchen and the supermarket.
More details (PDF)Open PDF
Wanna see a live render of AMP?Open website
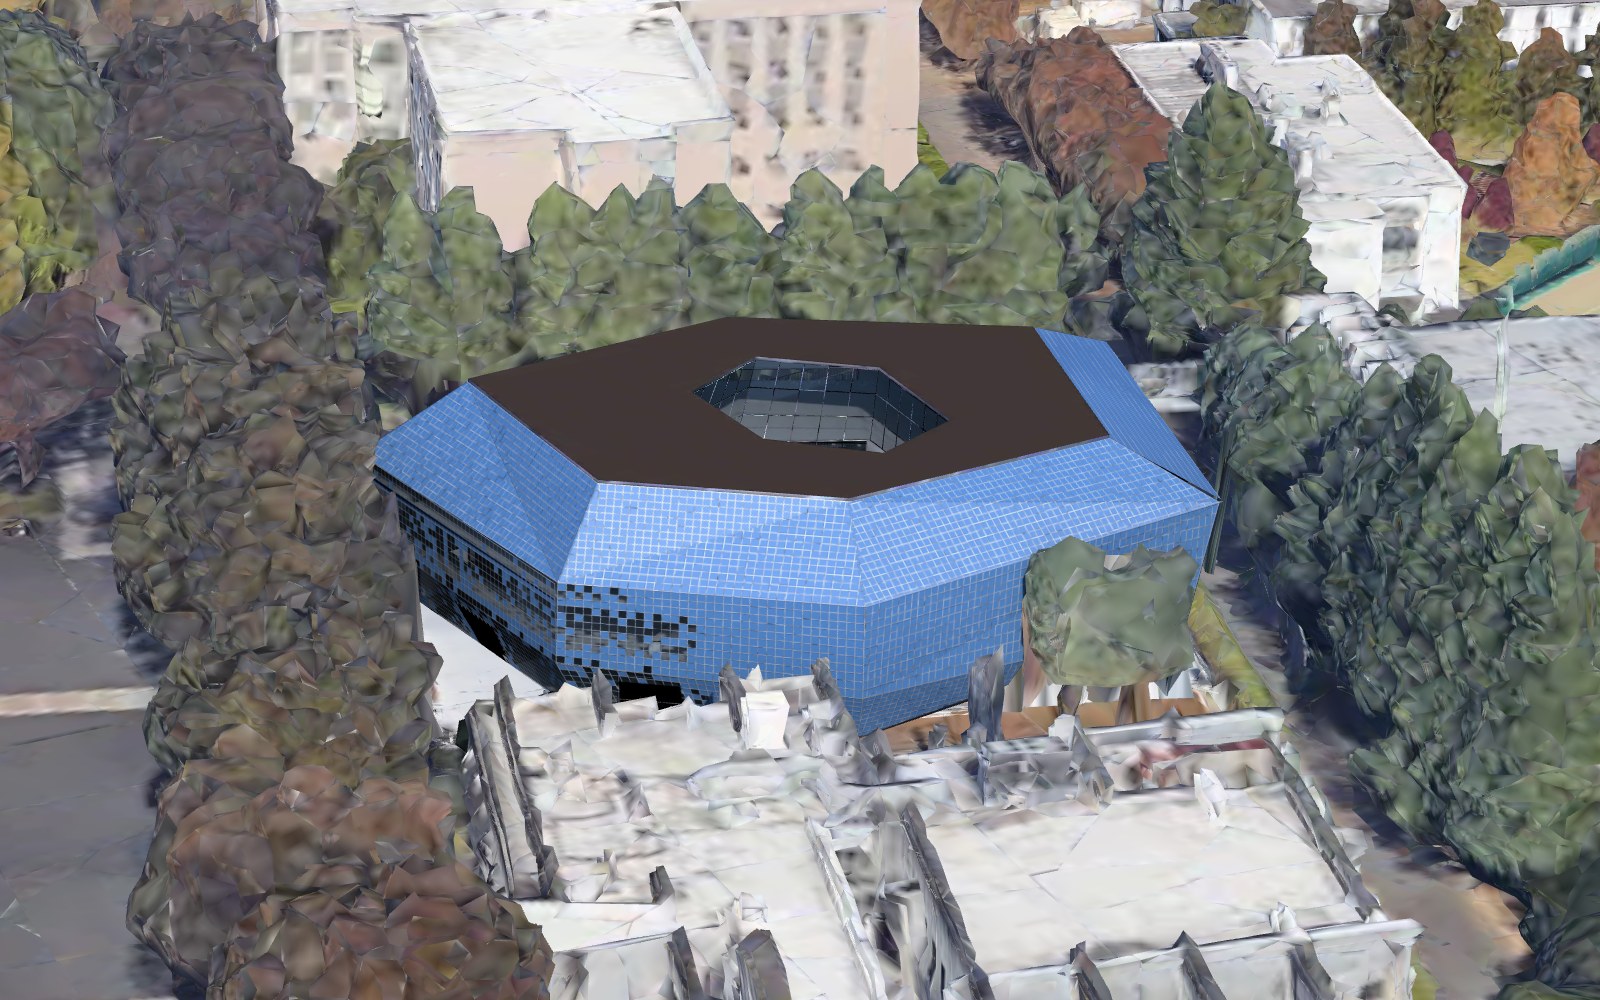
AMP on the Omiya campus in 3D. Drag to look around.
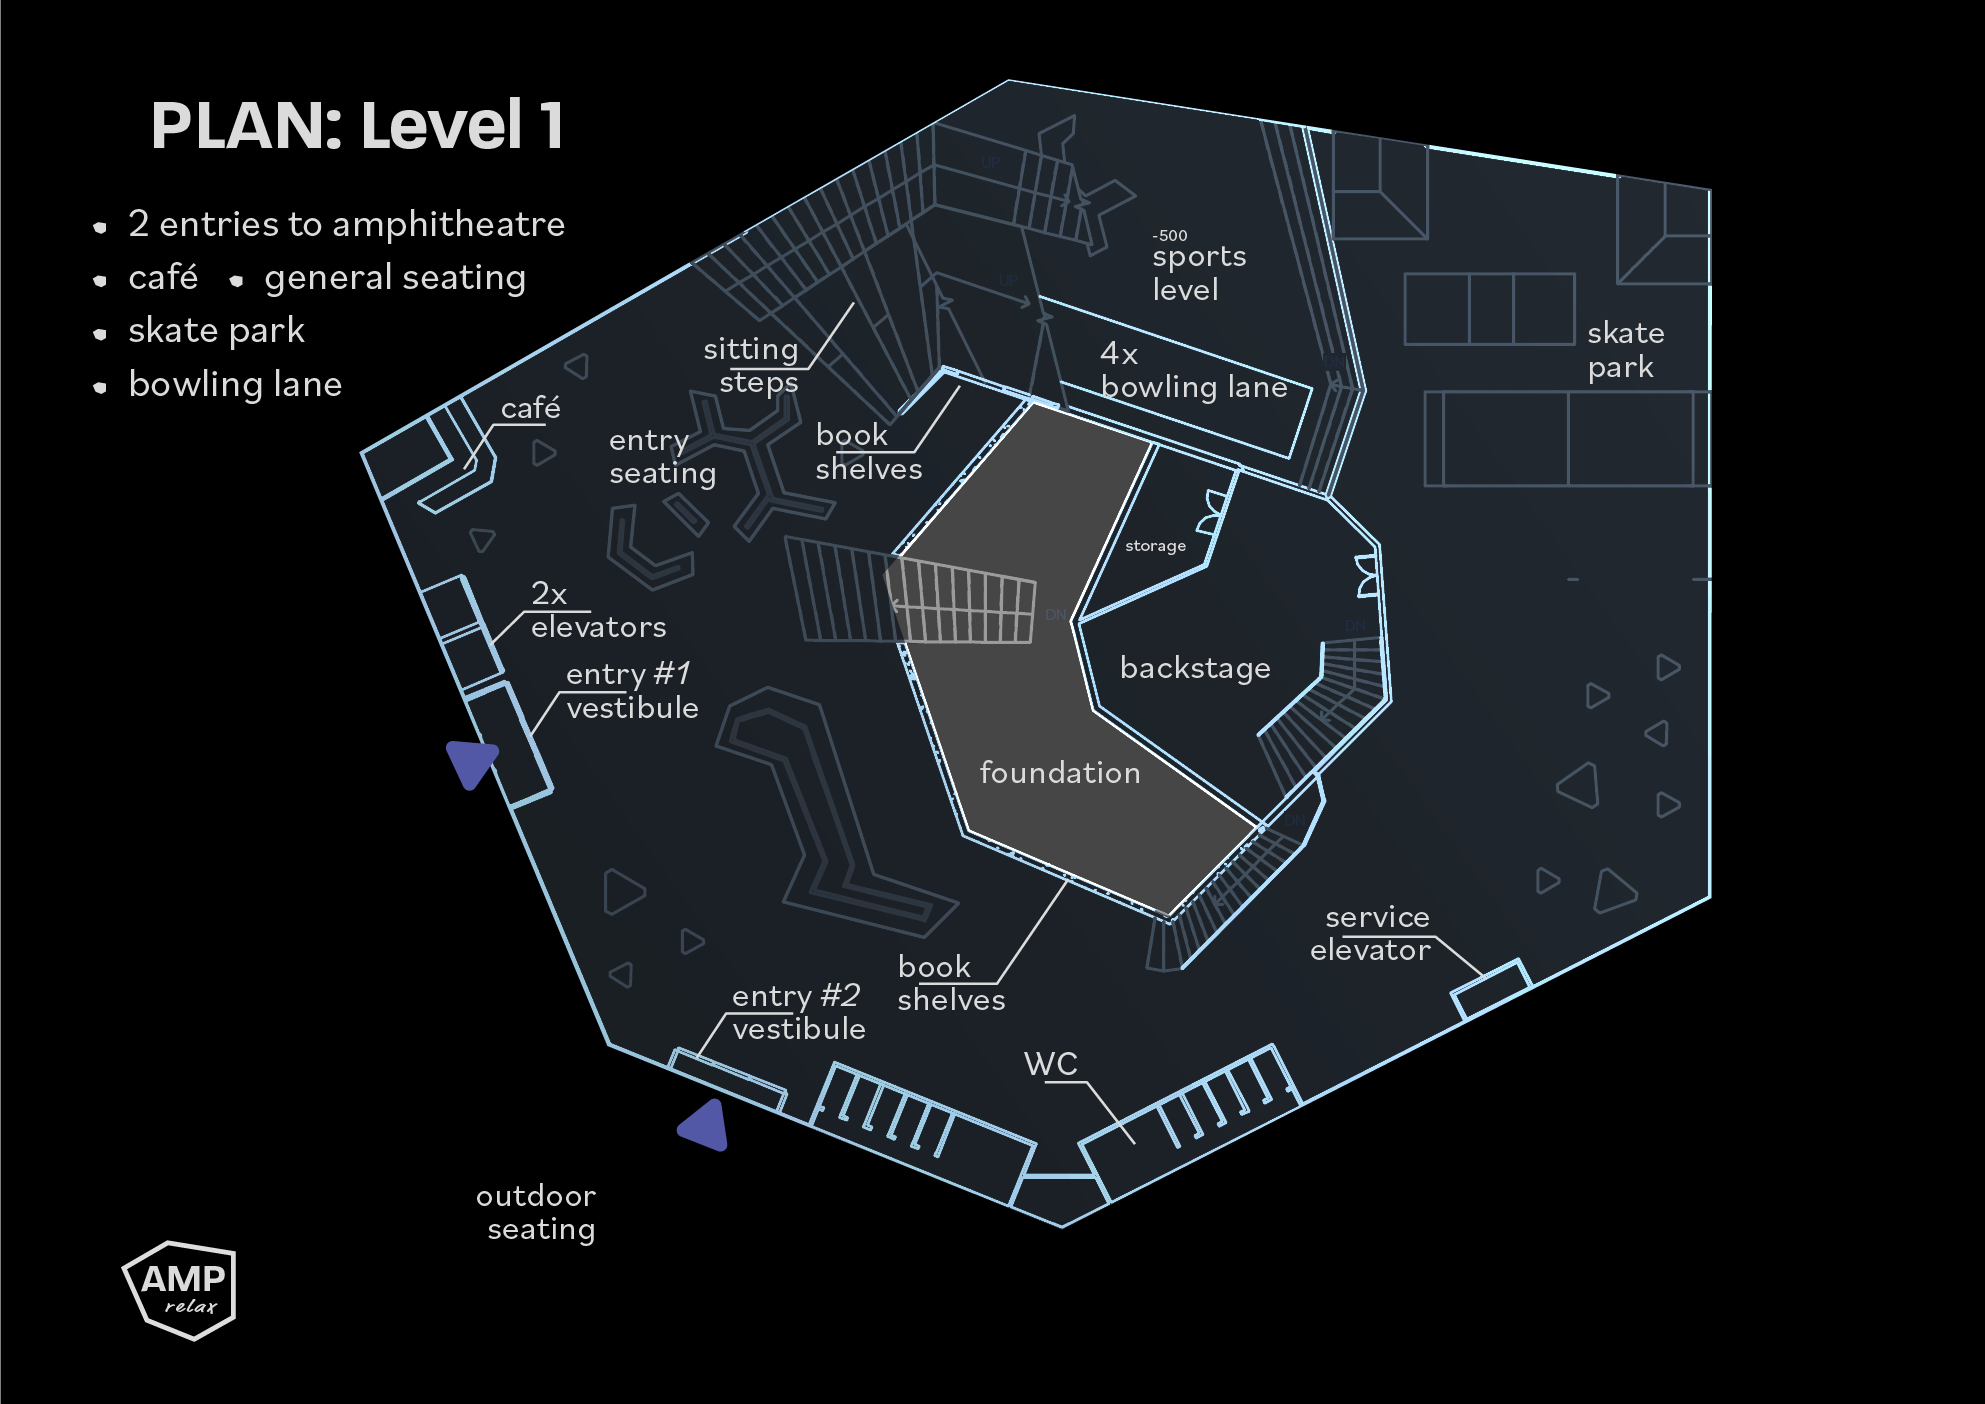
Plan of ground floor of AMP.
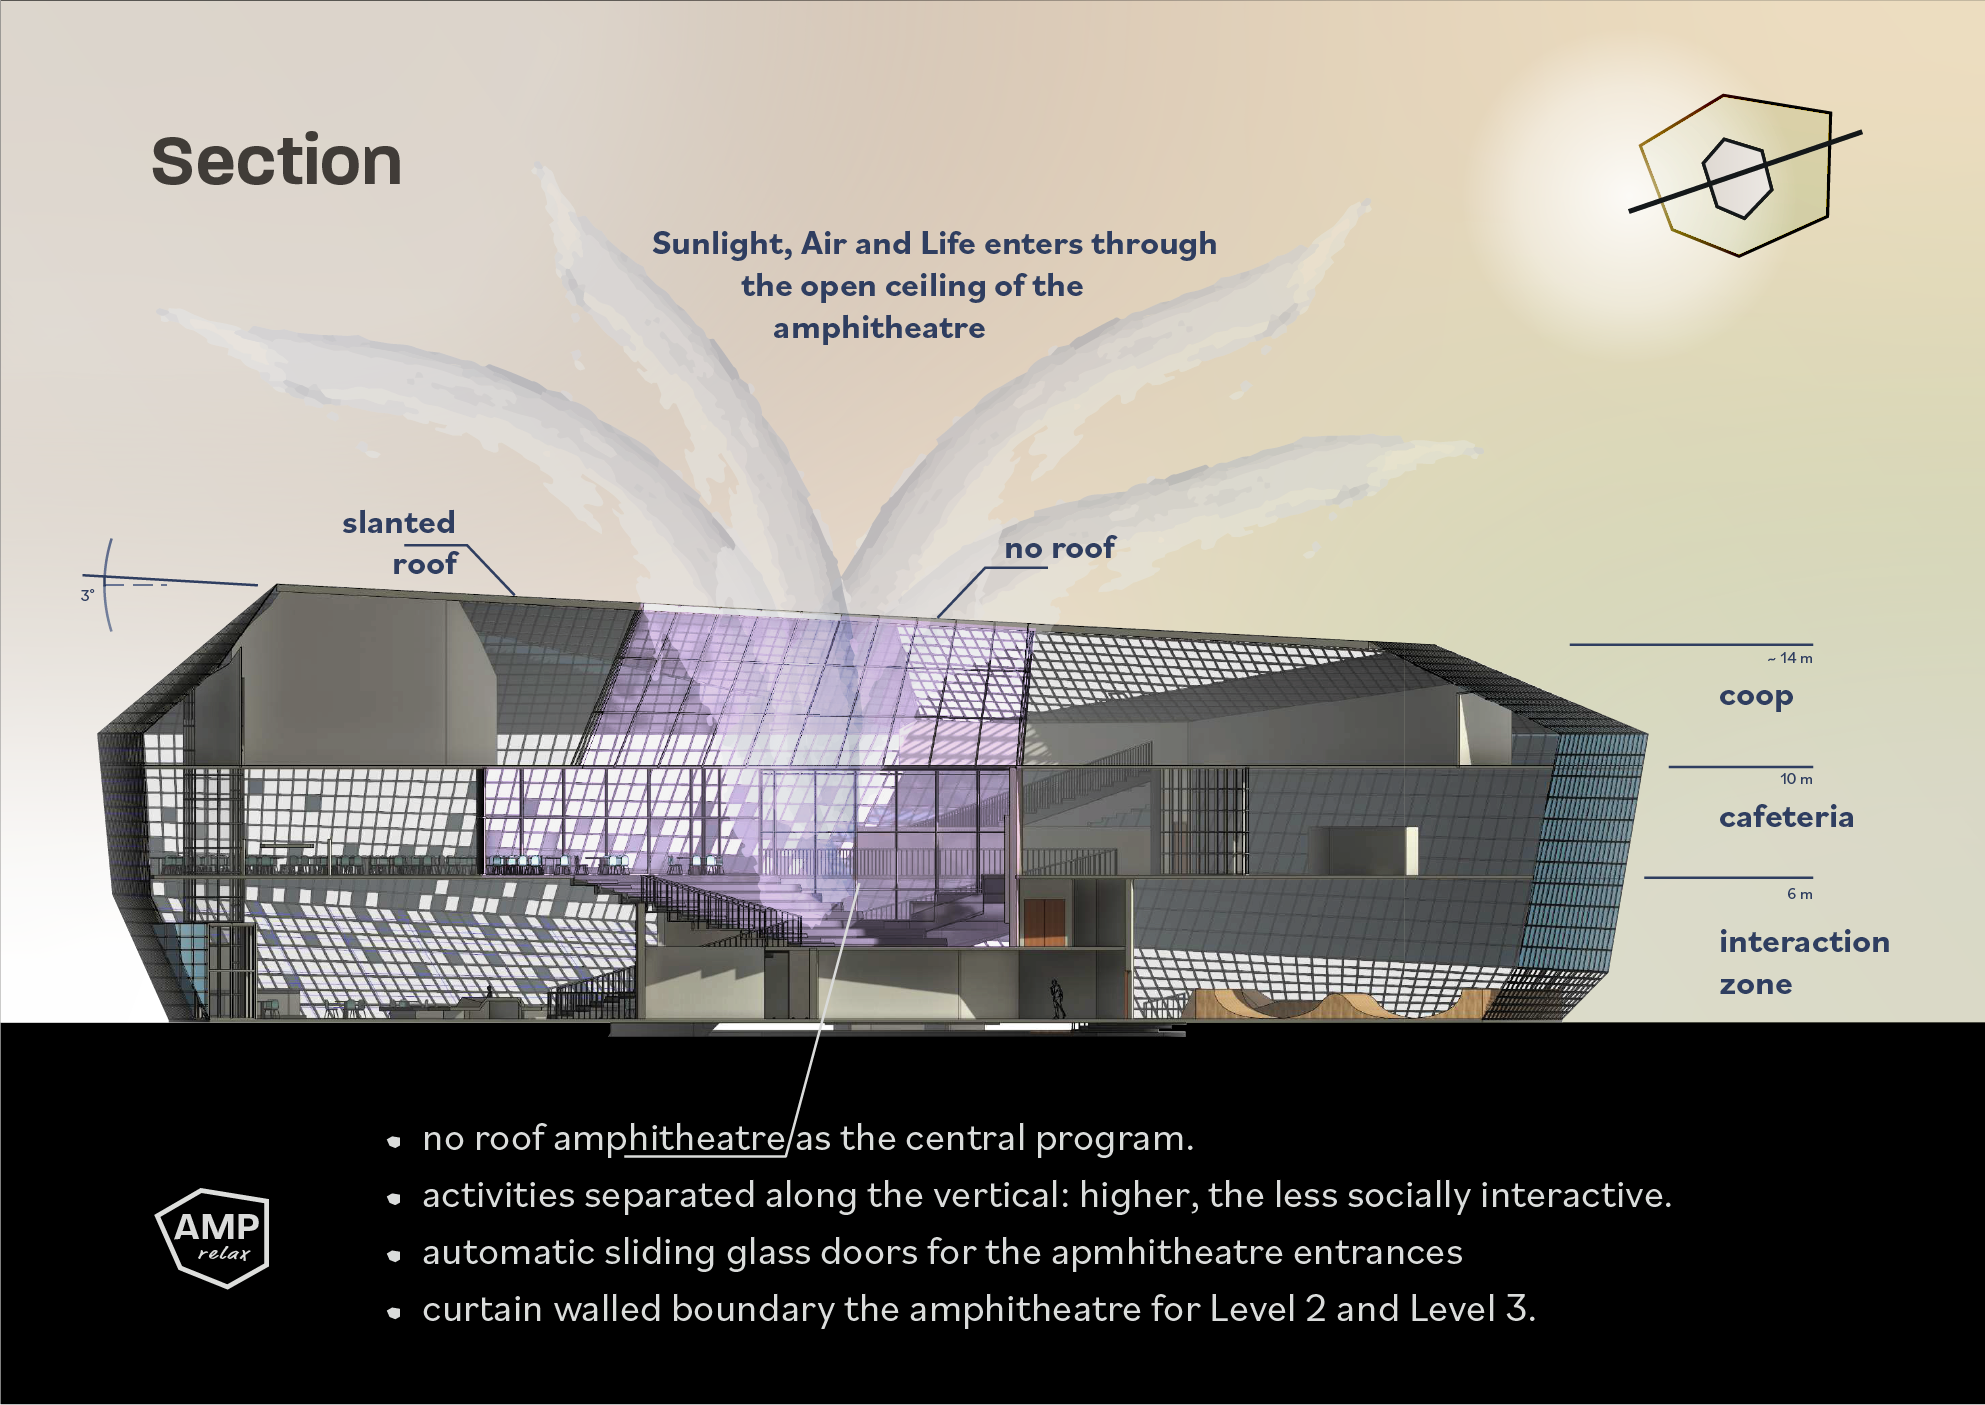
Sectional view of AMP.
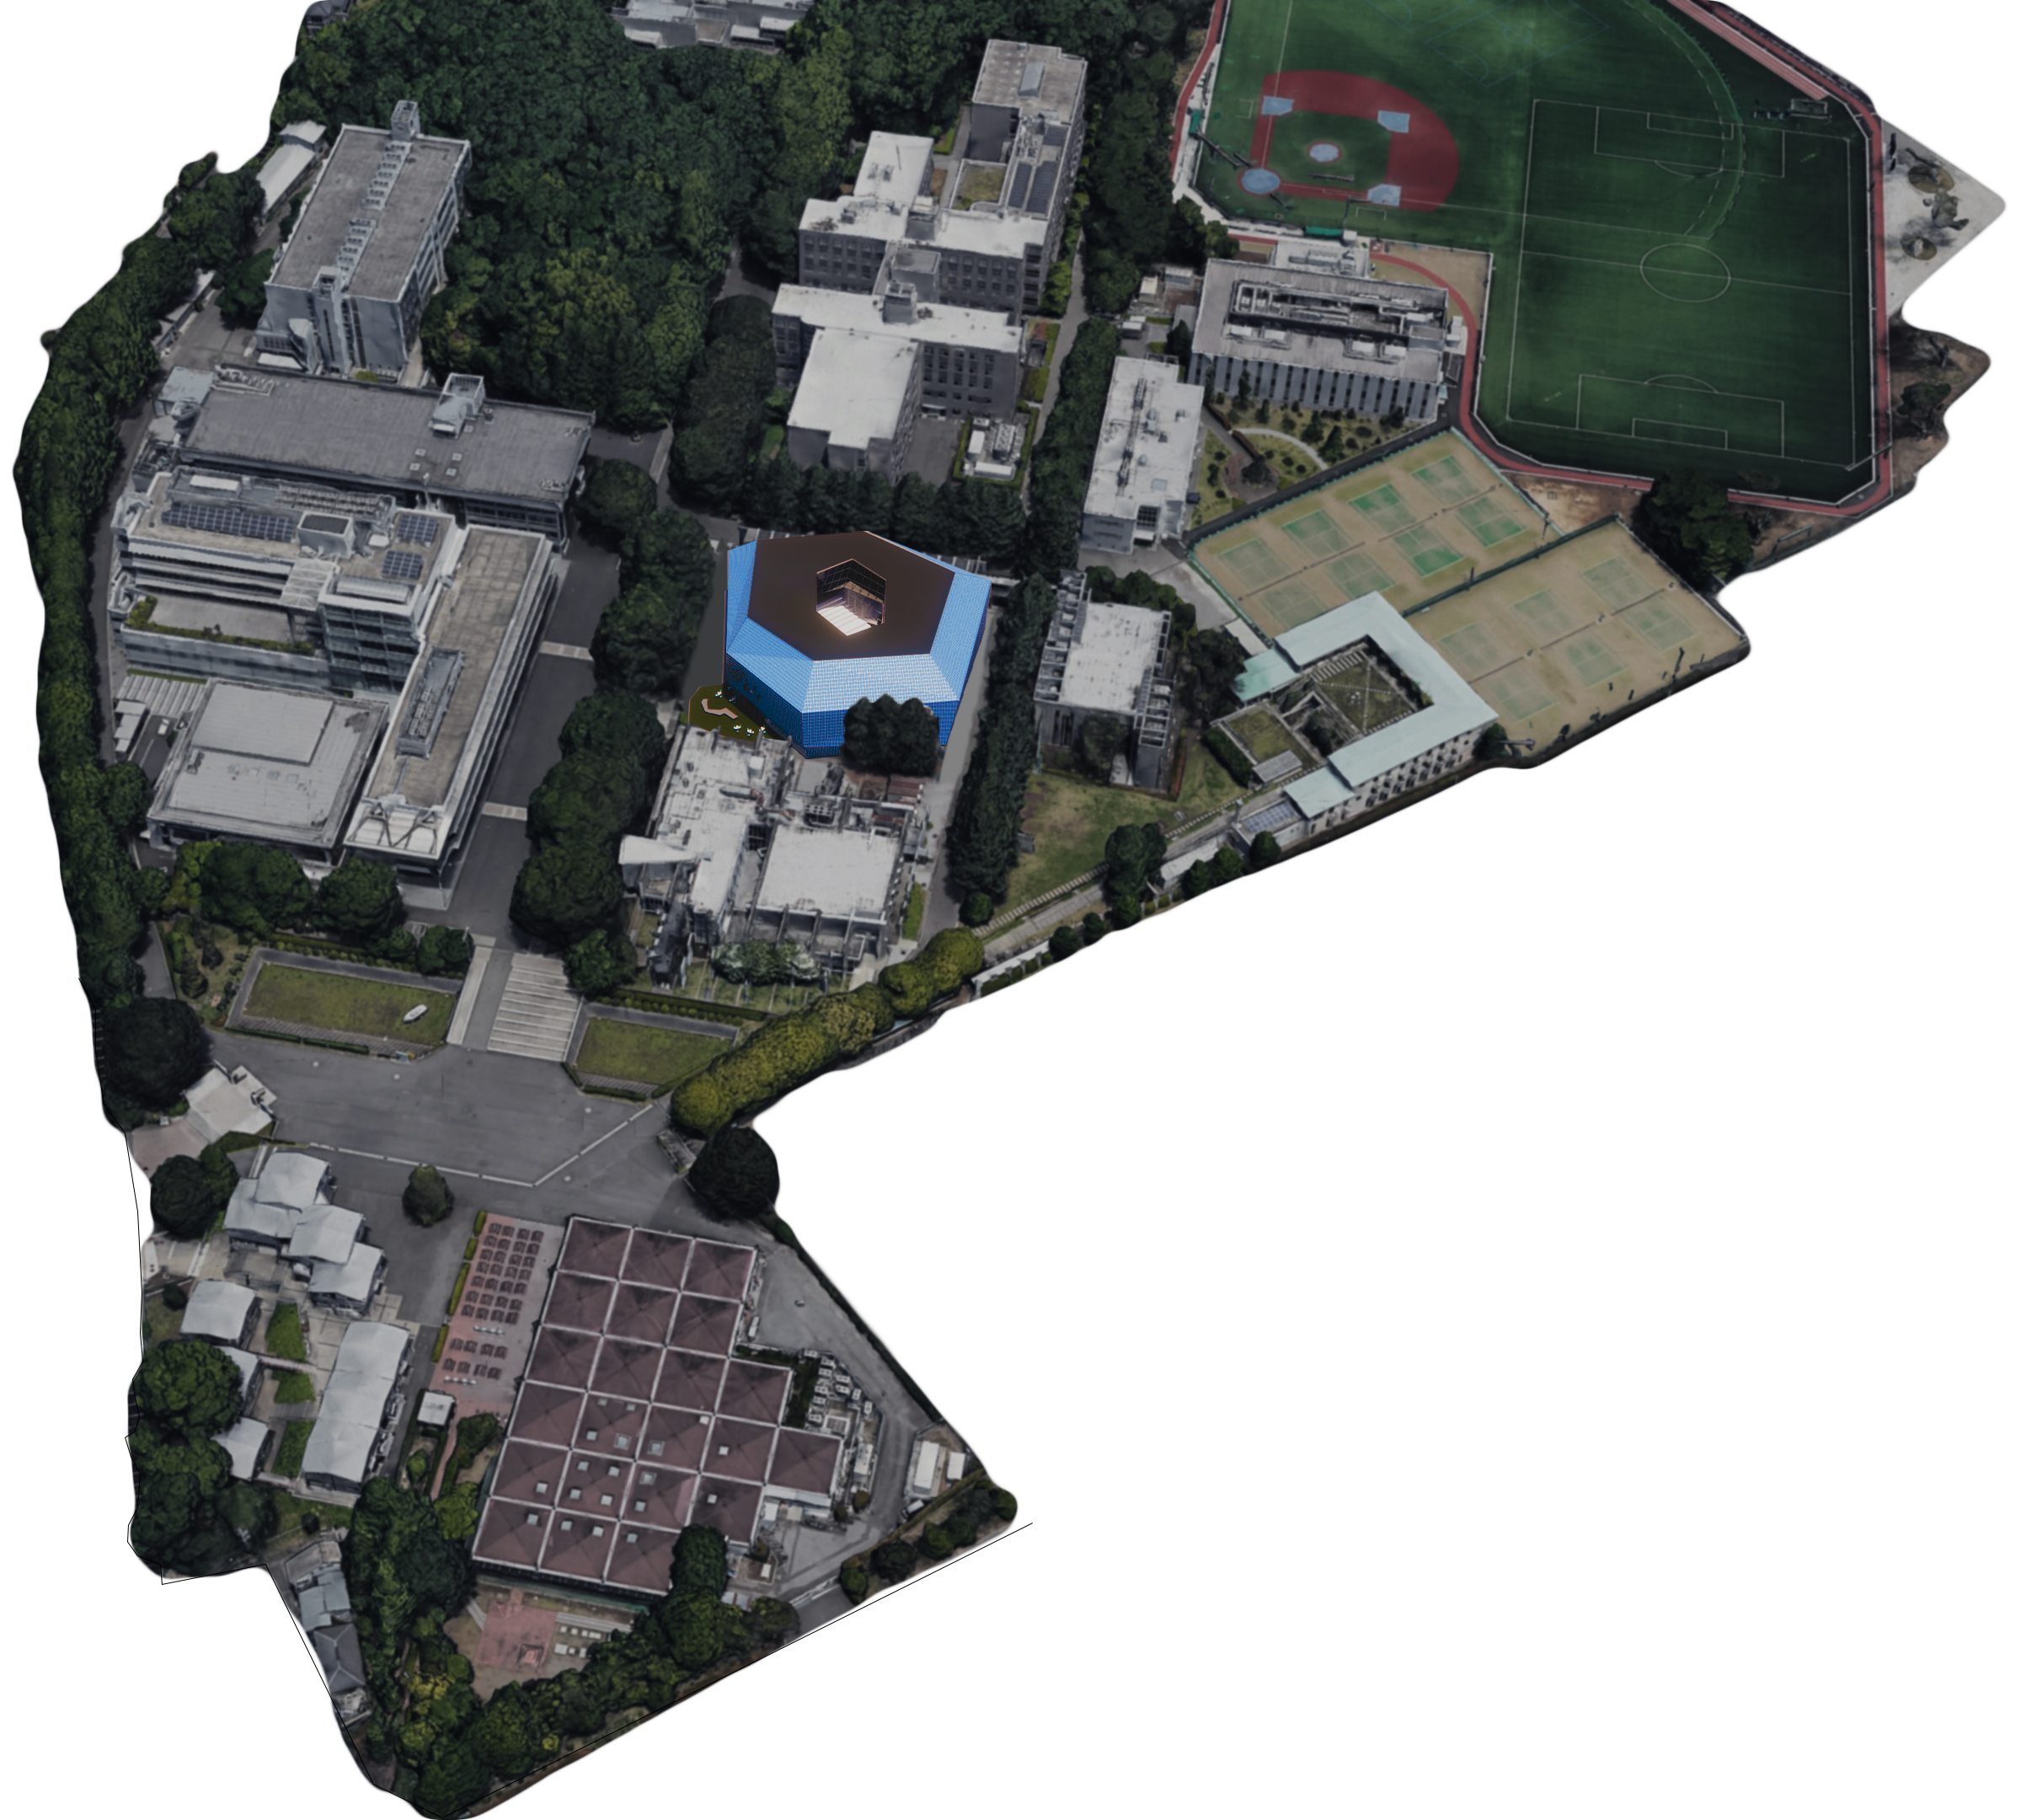
A Bird's Eye view of AMP (blue).
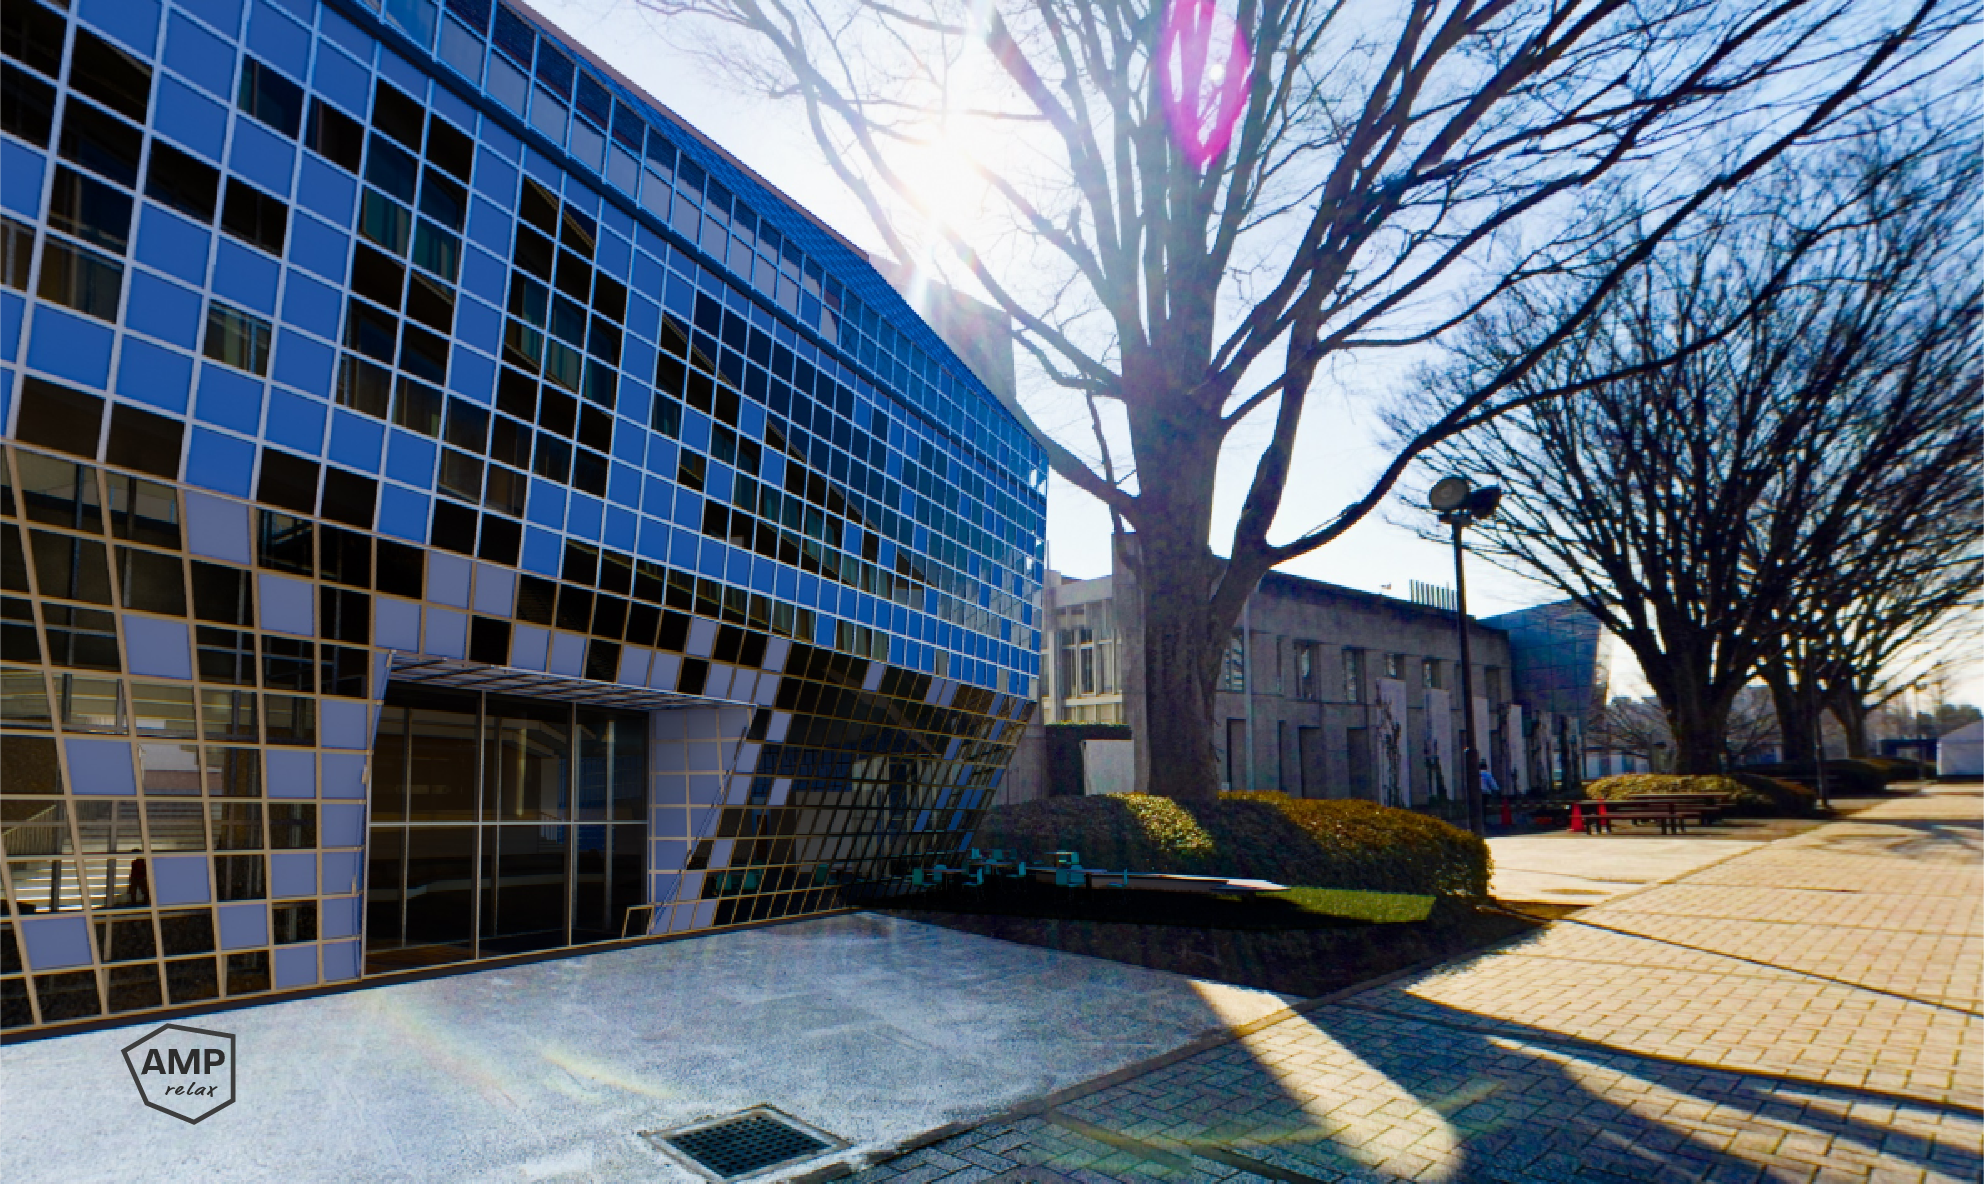
View of AMP from its main entrance.
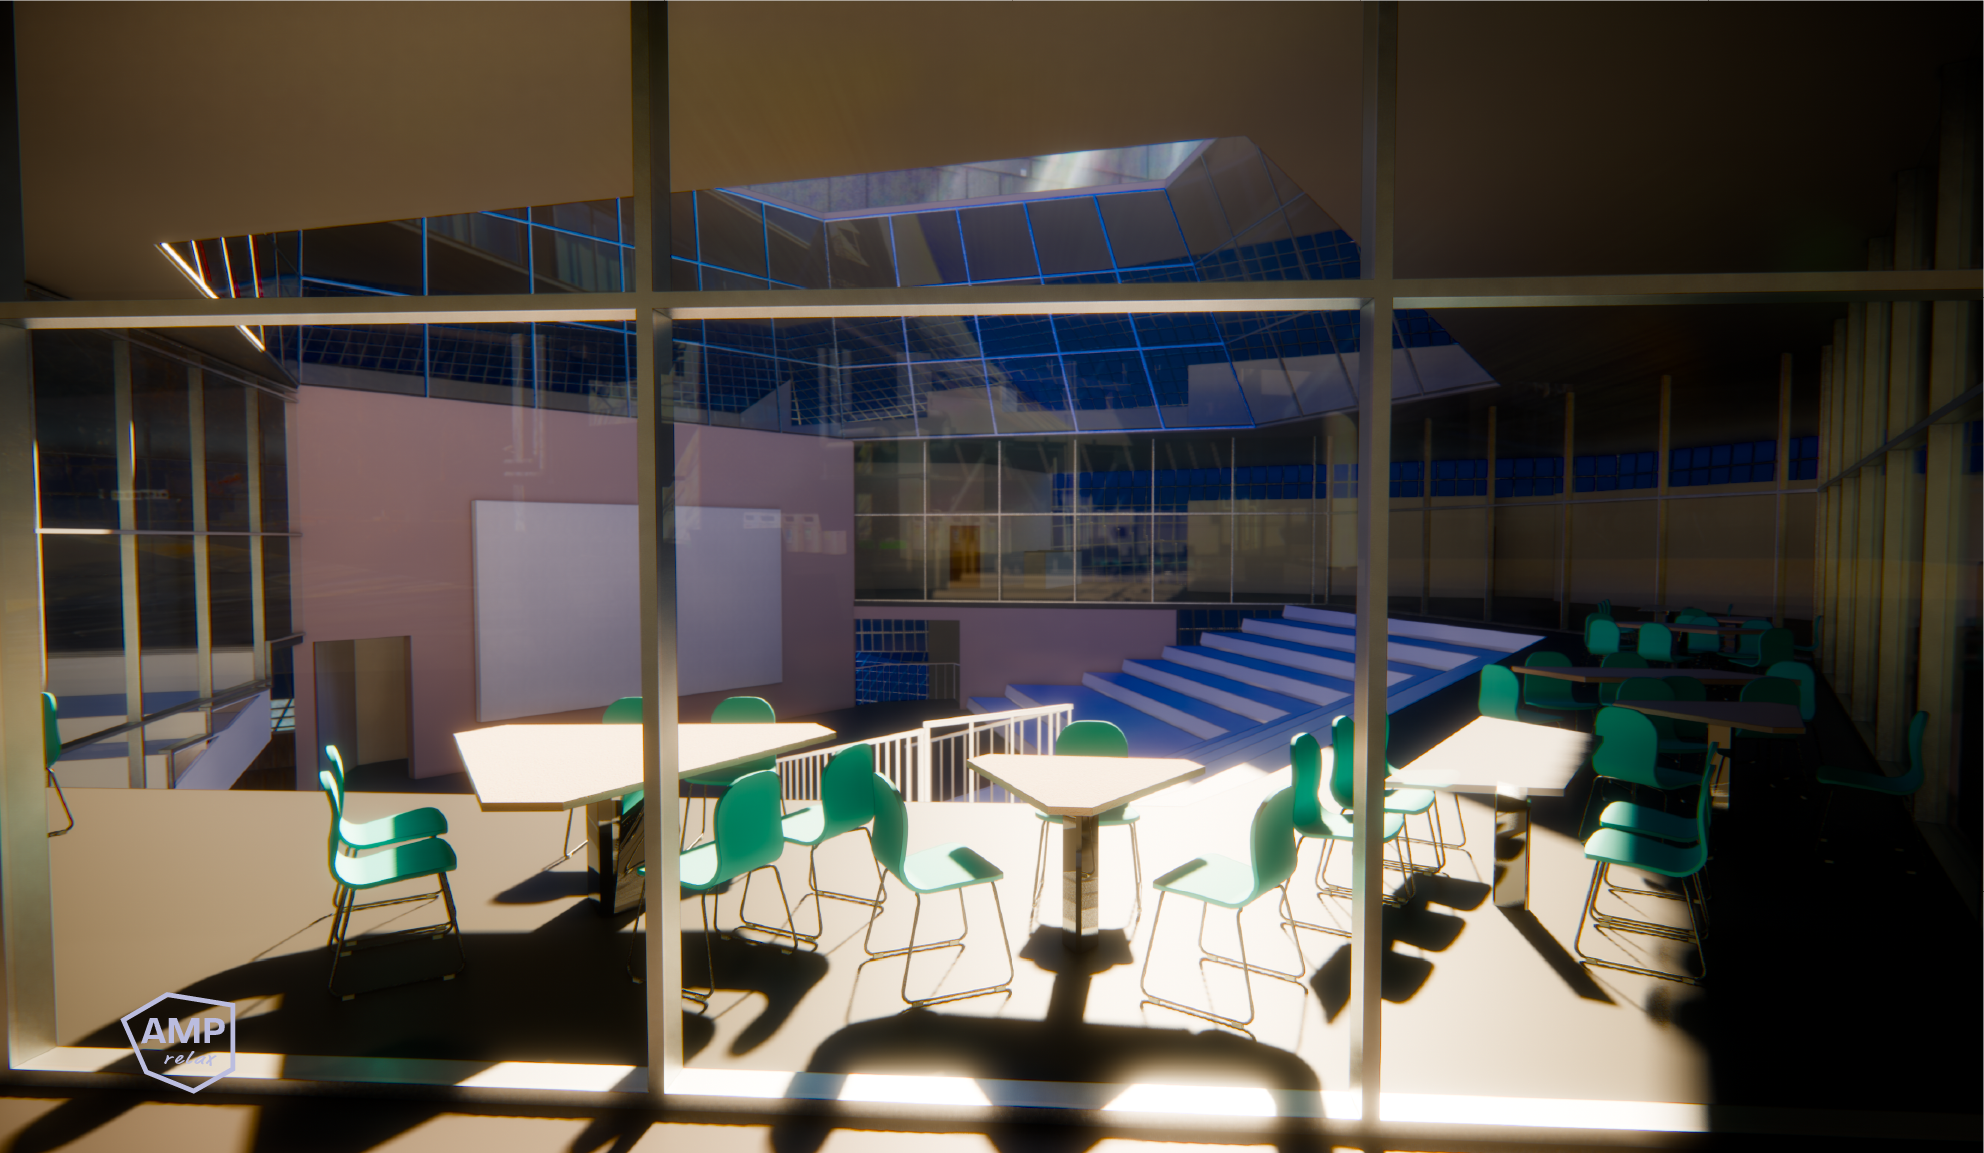
Rendering of Amphitheatre at the core.
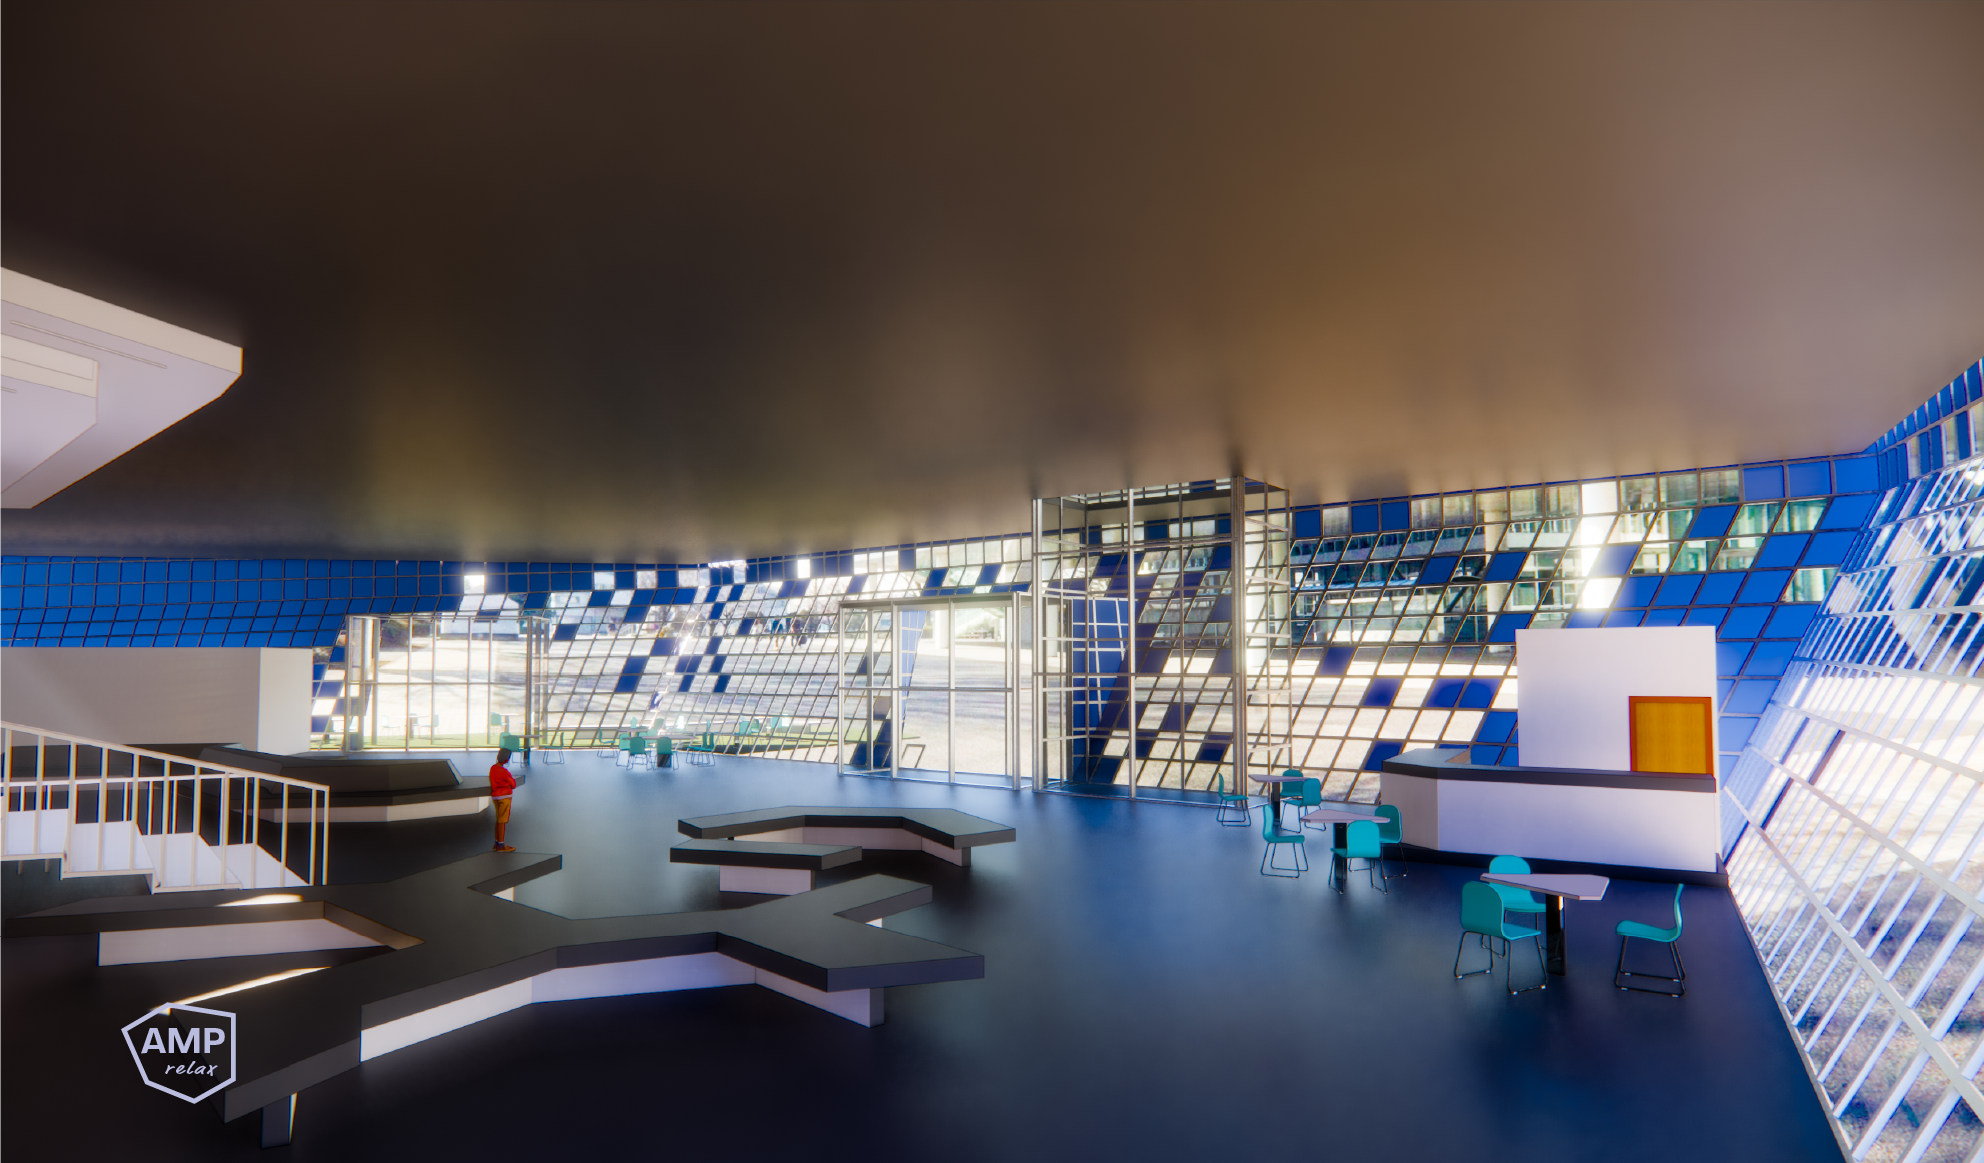
Rendering of ground floor.

Point Peak Halo

A Green Crescent
Draggy!
Freeform Gradients
artcodecomputationdesigngraphicsmathweb
Draggy is a dazzling web-based tool that uses magical math to create stunning spatial gradients from color points. With Draggy, you can easily adjust the position, color, and radius of each point to create a limitless variety of gradient effects. And thanks to Draggy's secret ingredient - shaders - you can create these gradients at lightning-fast speeds, with no lag or delay.
But what makes Draggy truly unique is its ability to create spatial gradients with fewer than four points. Unlike other design tools that rely on interpolation or triangulation, Draggy uses the following Laurent polynomial to calculate the weight of each color point (CP) in the final gradient. This allows for smooth, efficient gradients that are free of the color banding and unsaturated hues that plague other tools.
\[j _{\in \left[rgb,hsv\right]} = \dfrac{\displaystyle\sum_{i\in \textbf{CP}} j_i\times\left(\frac{1+i_R/10}{d_i}\right)^3}{\displaystyle\sum_{i\in \textbf{CP}}\left(\frac{1+i_R/10}{d_i}\right)^3}\]Here, \(i_R\) is the radius of influence of color point \(i\) and \(d_i\) is the distance of current pixel to the same color point.
To achieve the best possible color quality in the final gradient, Draggy uses a clever mix of RGB and HSV color values. Pure HSV can create color banding, while pure RGB can result in unsaturated colors when the hues of the color points are far apart. By using a mix of these color spaces, Draggy is able to avoid these problems and create gradients with rich, vibrant colors.
And thanks to Draggy's use of shaders, the whole process is super-speedy and smooth. Shaders are programs that run on the graphics processing unit (GPU) and are specifically designed to handle the complex mathematical operations required for rendering graphics. By using shaders to calculate the colors in Draggy, you can take advantage of the GPU's specialized capabilities and achieve a level of performance that simply isn't possible with other tools.
In the future, Draggy will get even more awesome with the addition of new features and functionality. You'll be able to change the algorithm used for color generation, create a framework for saving gradients, and even add a curve-color controller in addition to points. Whether you're a designer, artist, or just someone who loves playing with color, Draggy is the perfect tool for creating mesmerizing spatial gradients. So why not give it a spin and see what magic you can create?
Let me make some!Open in Draggy, Where is the second picture?Open in Draggy
Triangles!
Delanauy Colours
artcodecomputationdesigngraphicsmathweb
Triangles is a unique coding project that creates stunning gradient effects by applying Delaunay triangulation to a rectangle. The system starts by randomly selecting a few key points in the rectangle and assigning them vibrant colors. Then, using the Delaunay algorithm, the rectangle is triangulated into a beautiful mesh of triangles. The colors of these triangles are calculated using bivariate spline interpolation, resulting in a mesmerizing gradient effect that covers the entire rectangle.
To add even more visual interest to the final image, Triangles uses dominant and recessive color points. The dominant points have a larger radius of influence, causing the surrounding area to take on their color. This creates bold, prominent spots in the gradient that add depth and texture to the final image. Triangles's clever use of Delaunay triangulation and bivariate spline interpolation makes for an efficient and aesthetically pleasing way to generate gradient effects.
In a future development of the project, called Draggy, interpolation is replaced with Laurent polynomials, making the computation even faster and more efficient. Triangles and Draggy are both innovative projects that showcase the creative possibilities of mathematical concepts in coding. Whether you're a seasoned coder or just starting out, these projects are sure to inspire and delight.
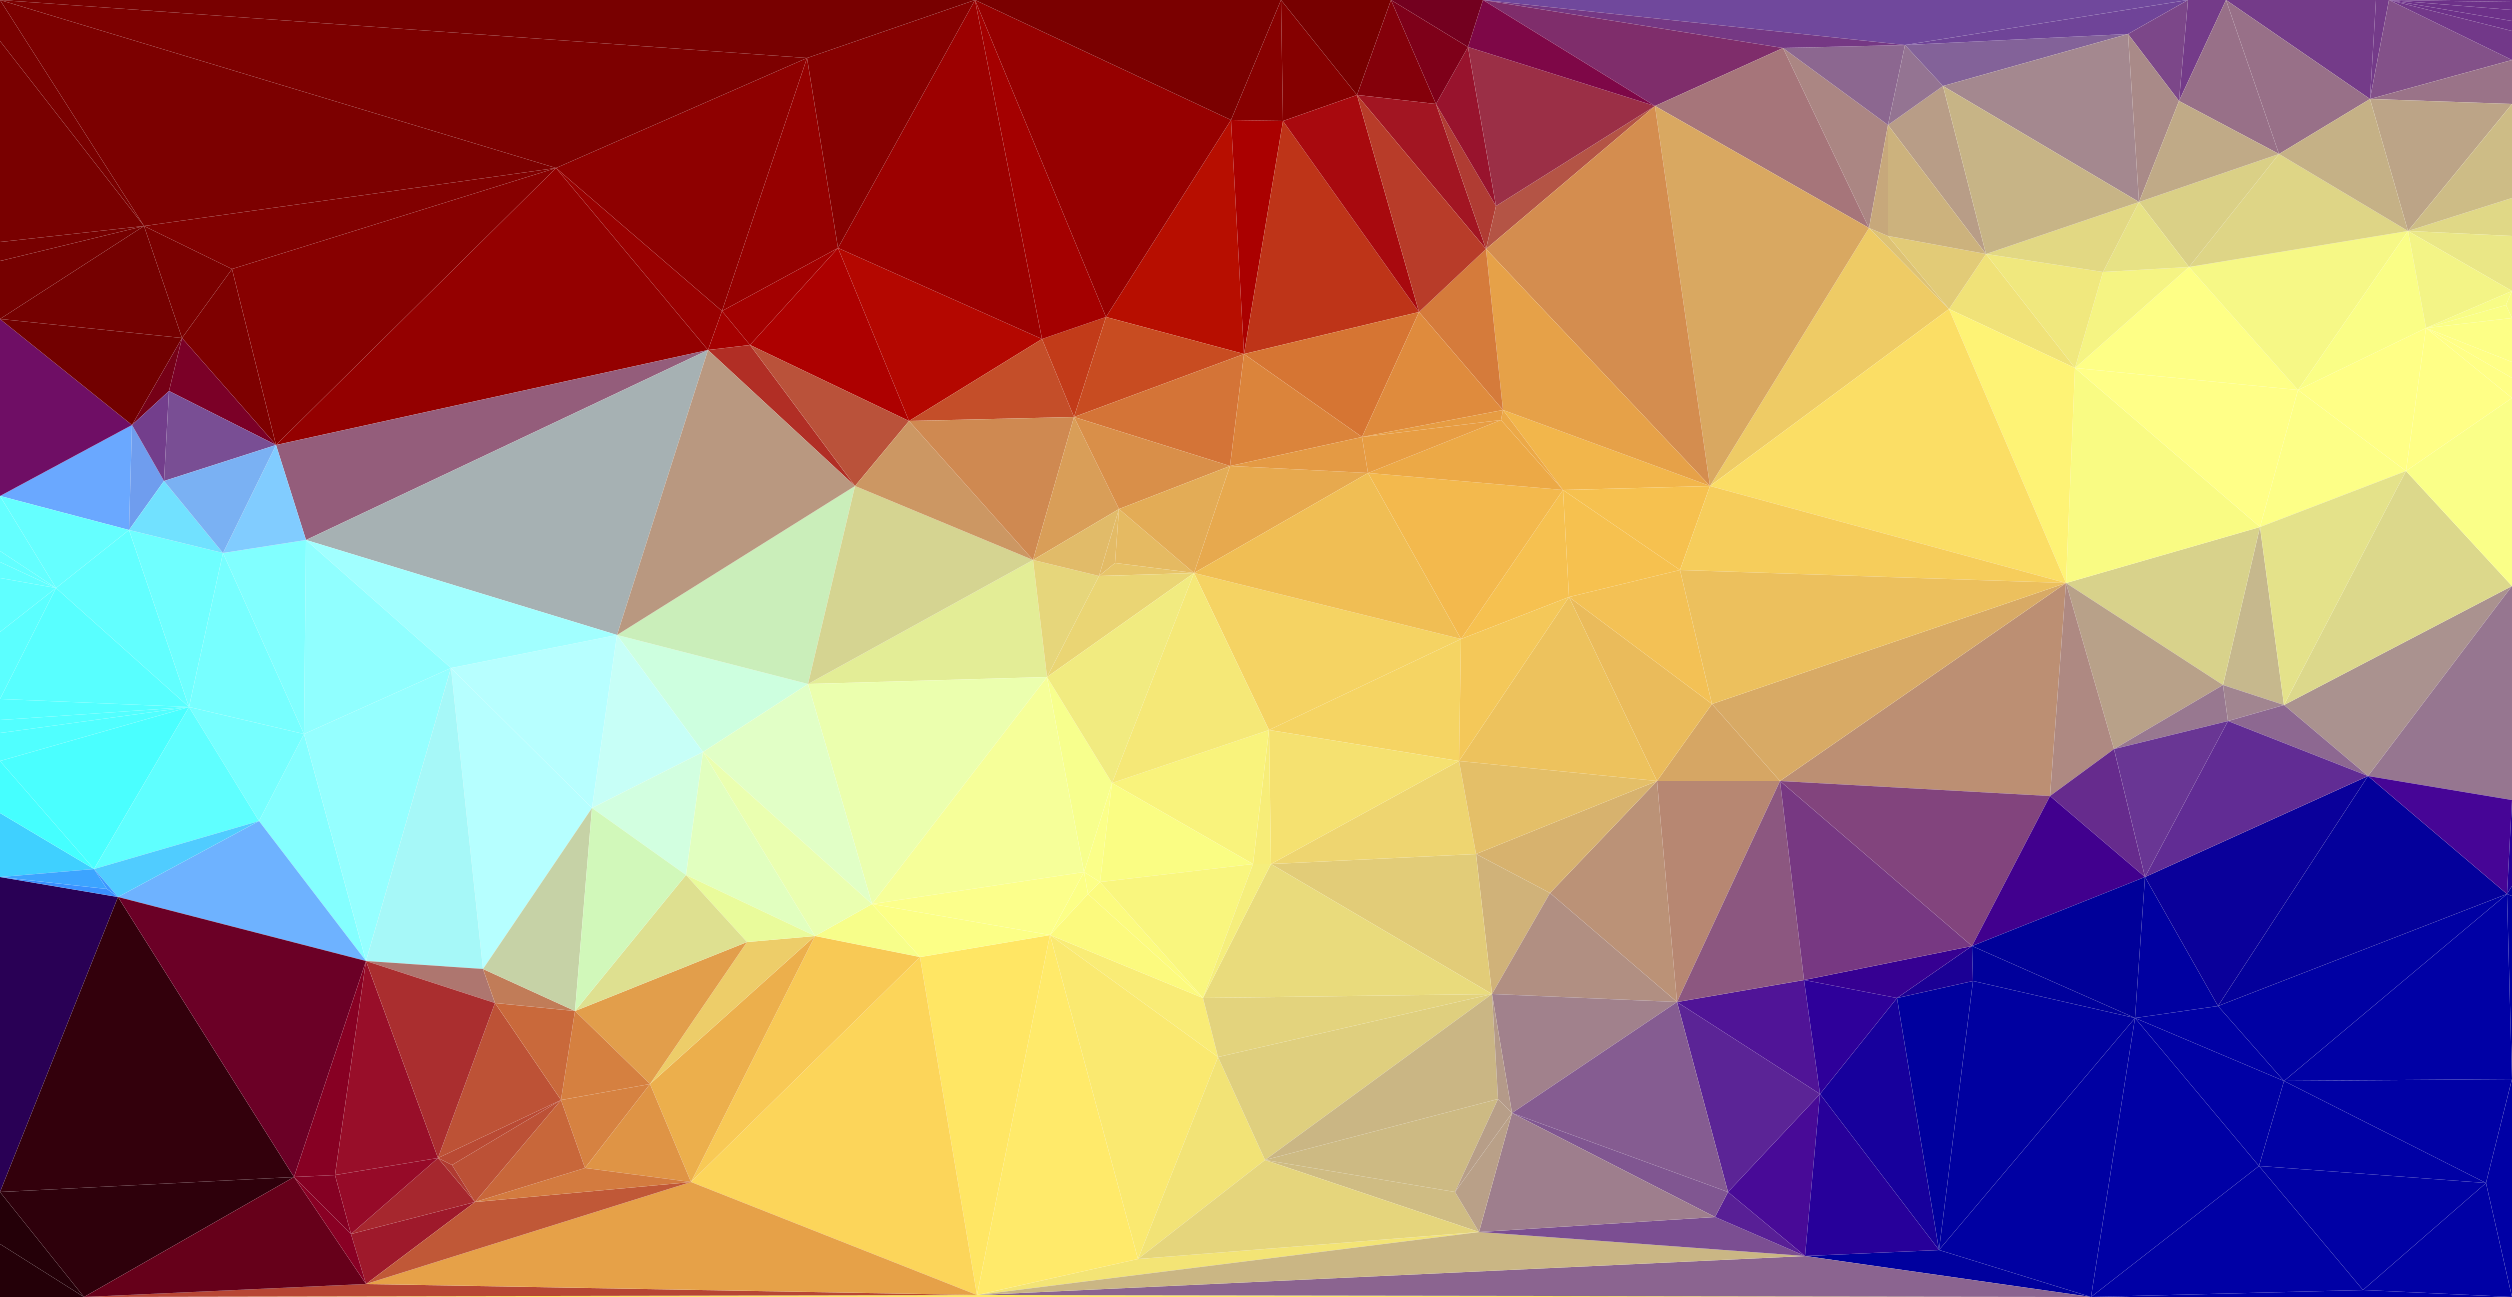
Maroon, Blue and Yellow
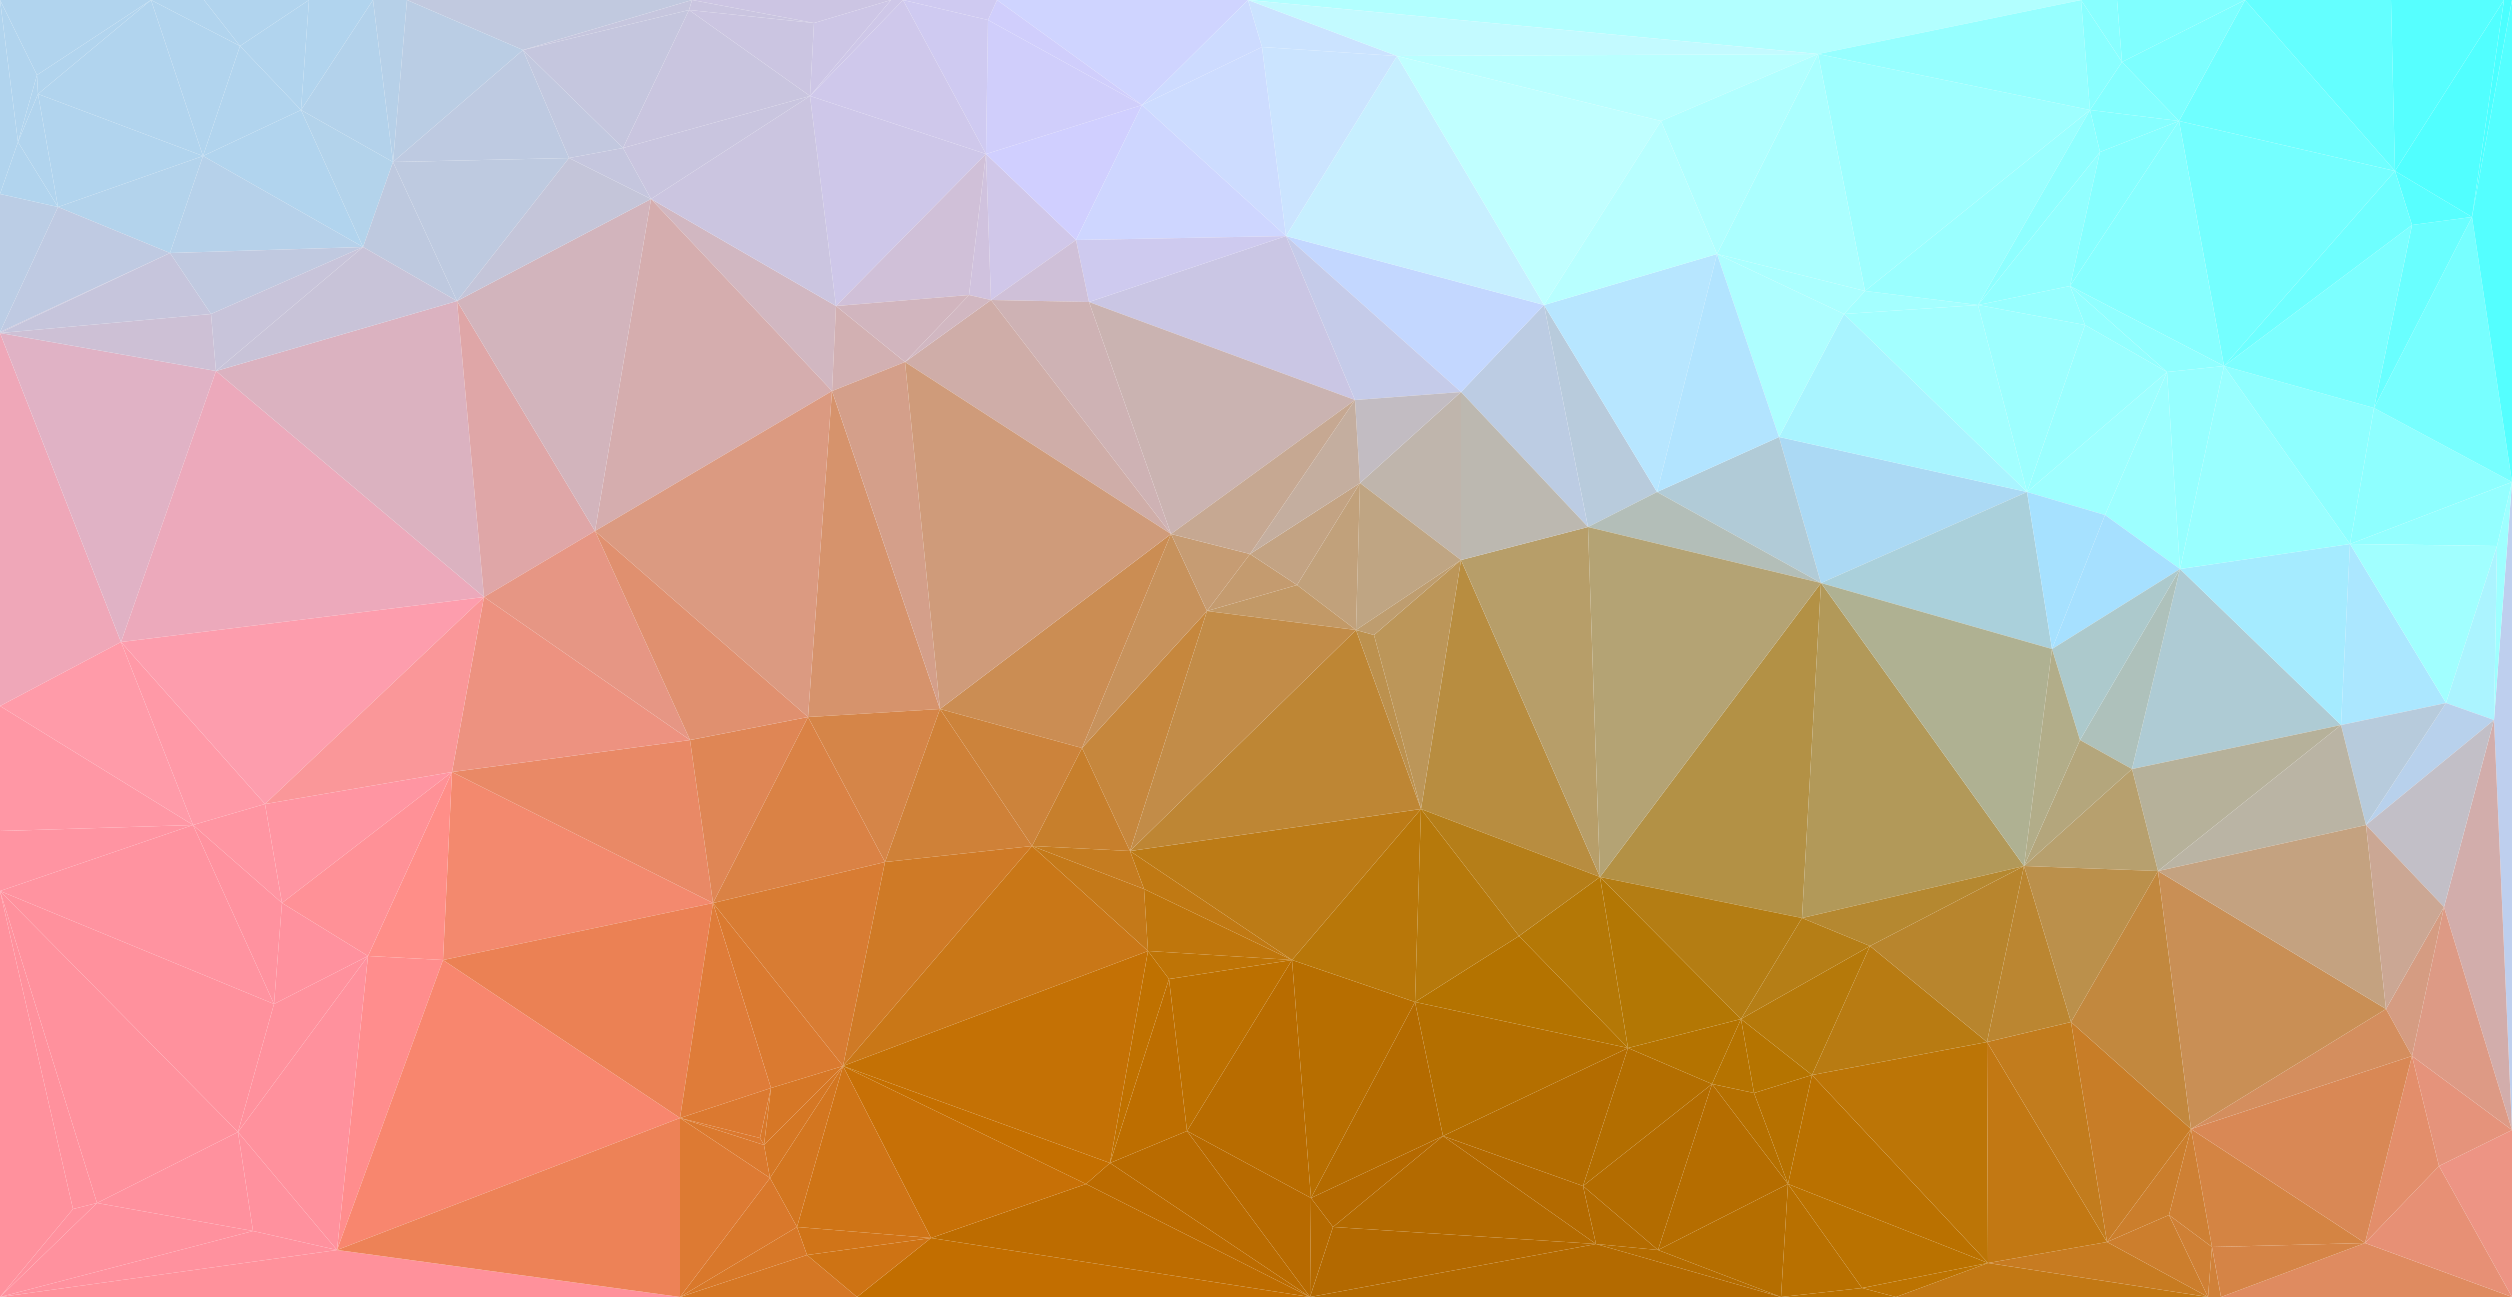
Earth and sky
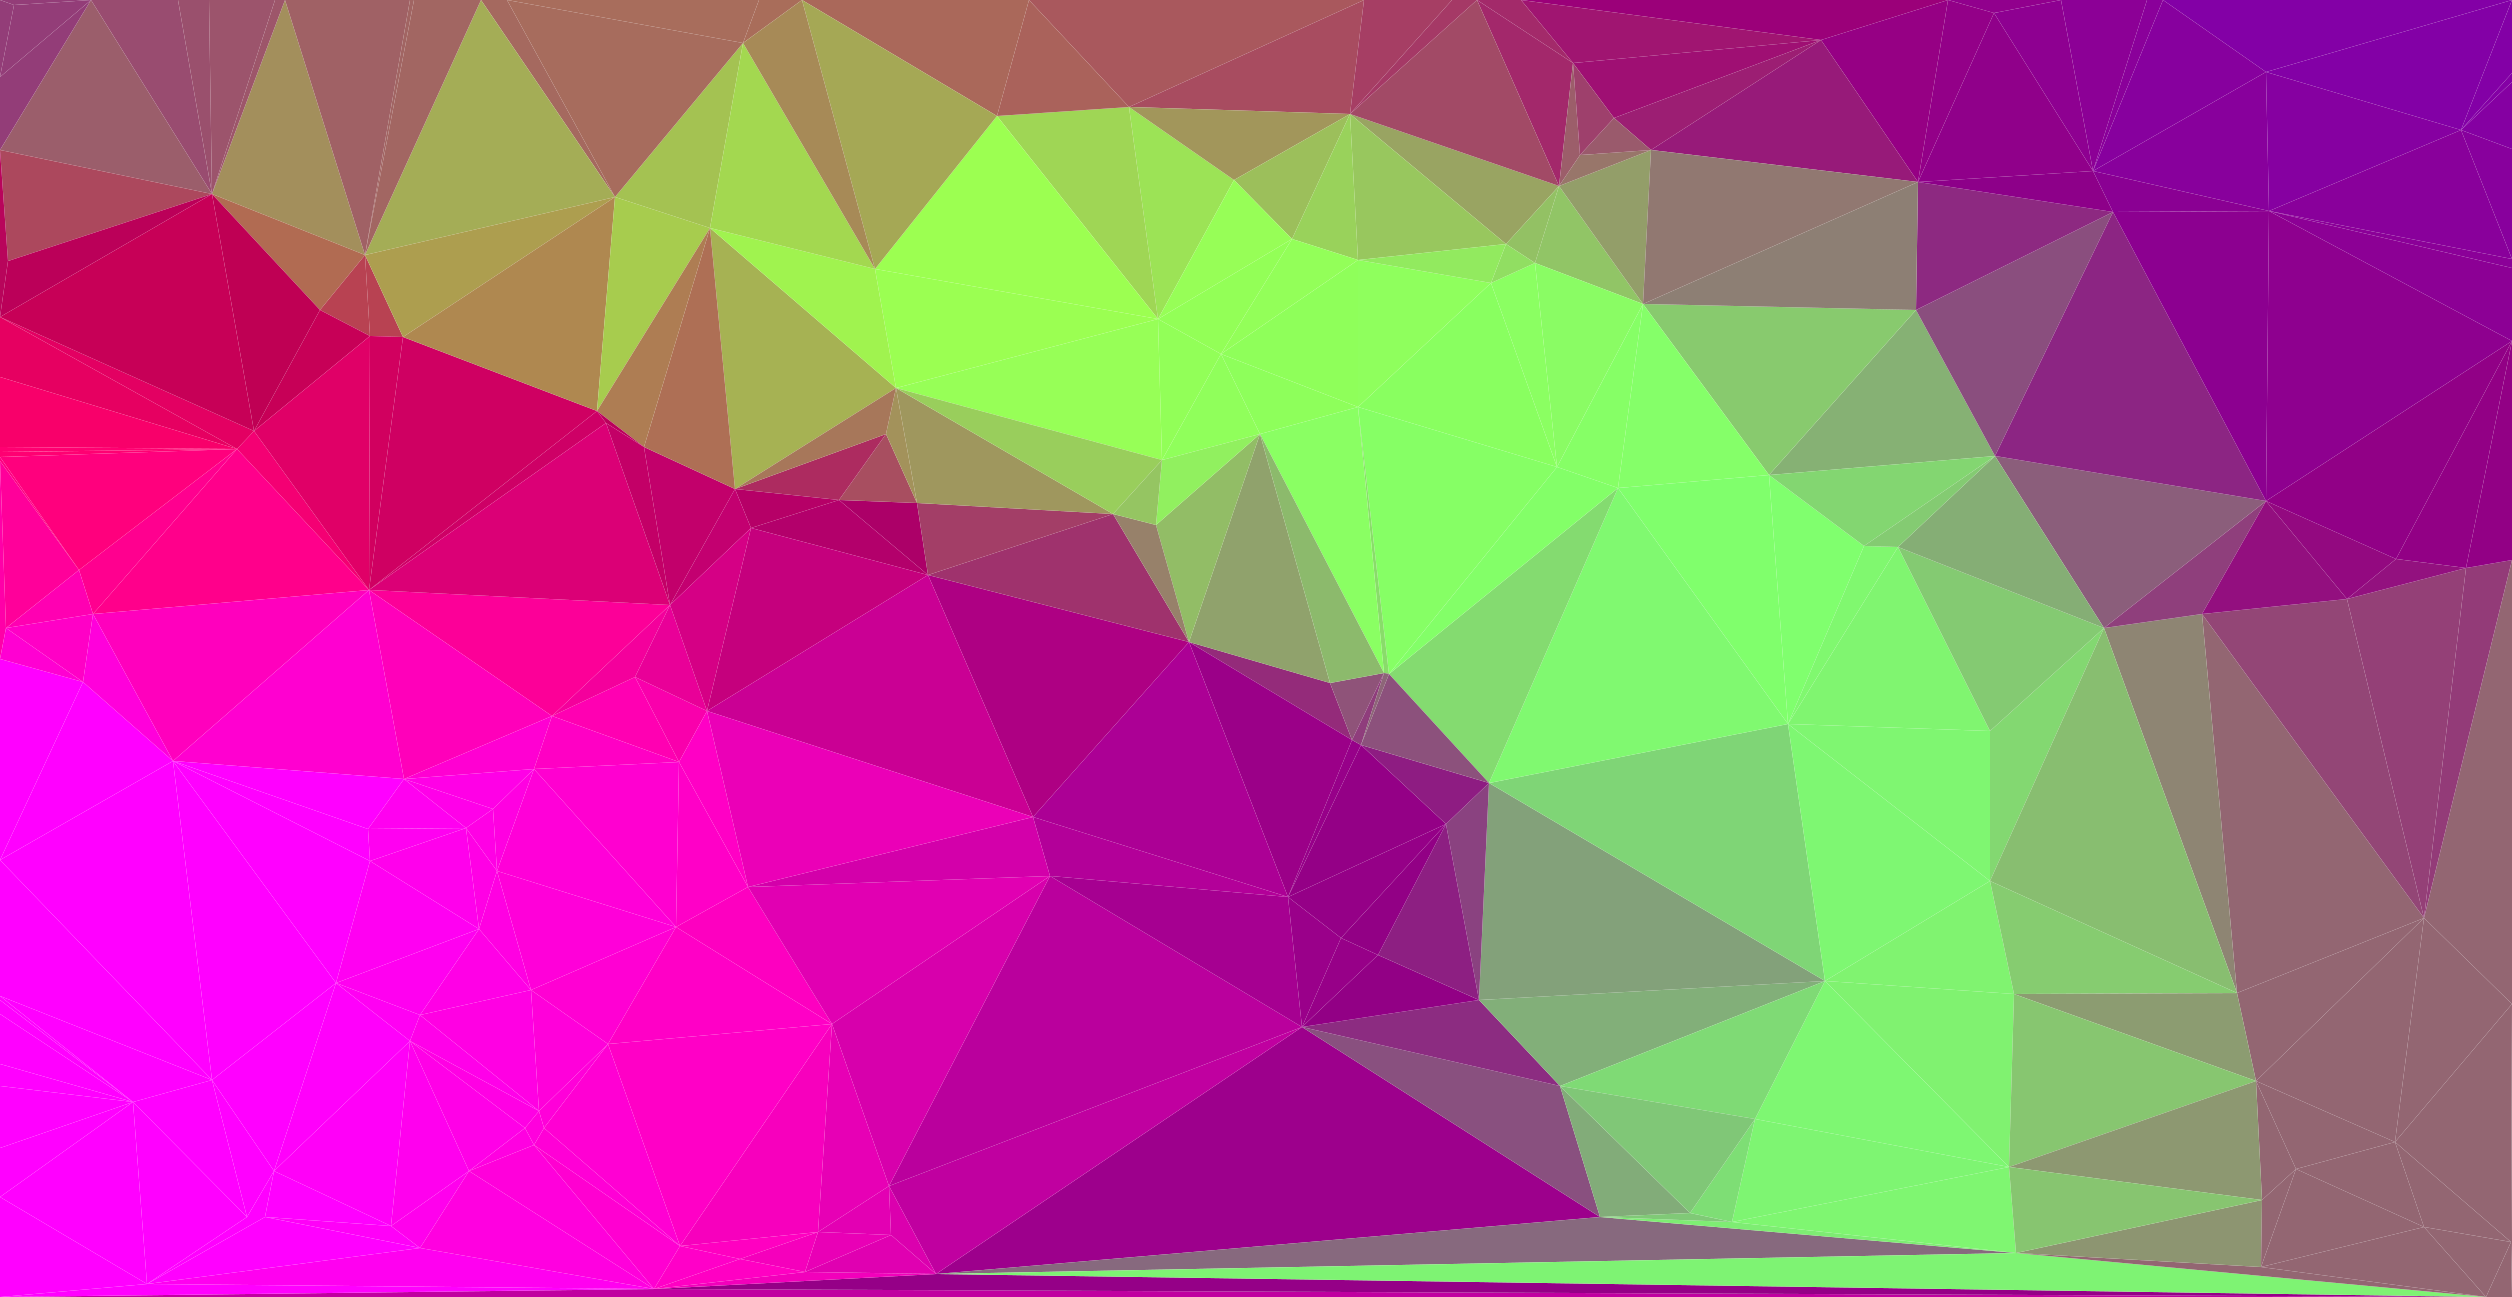
Crystal cave
Avada Kedavra
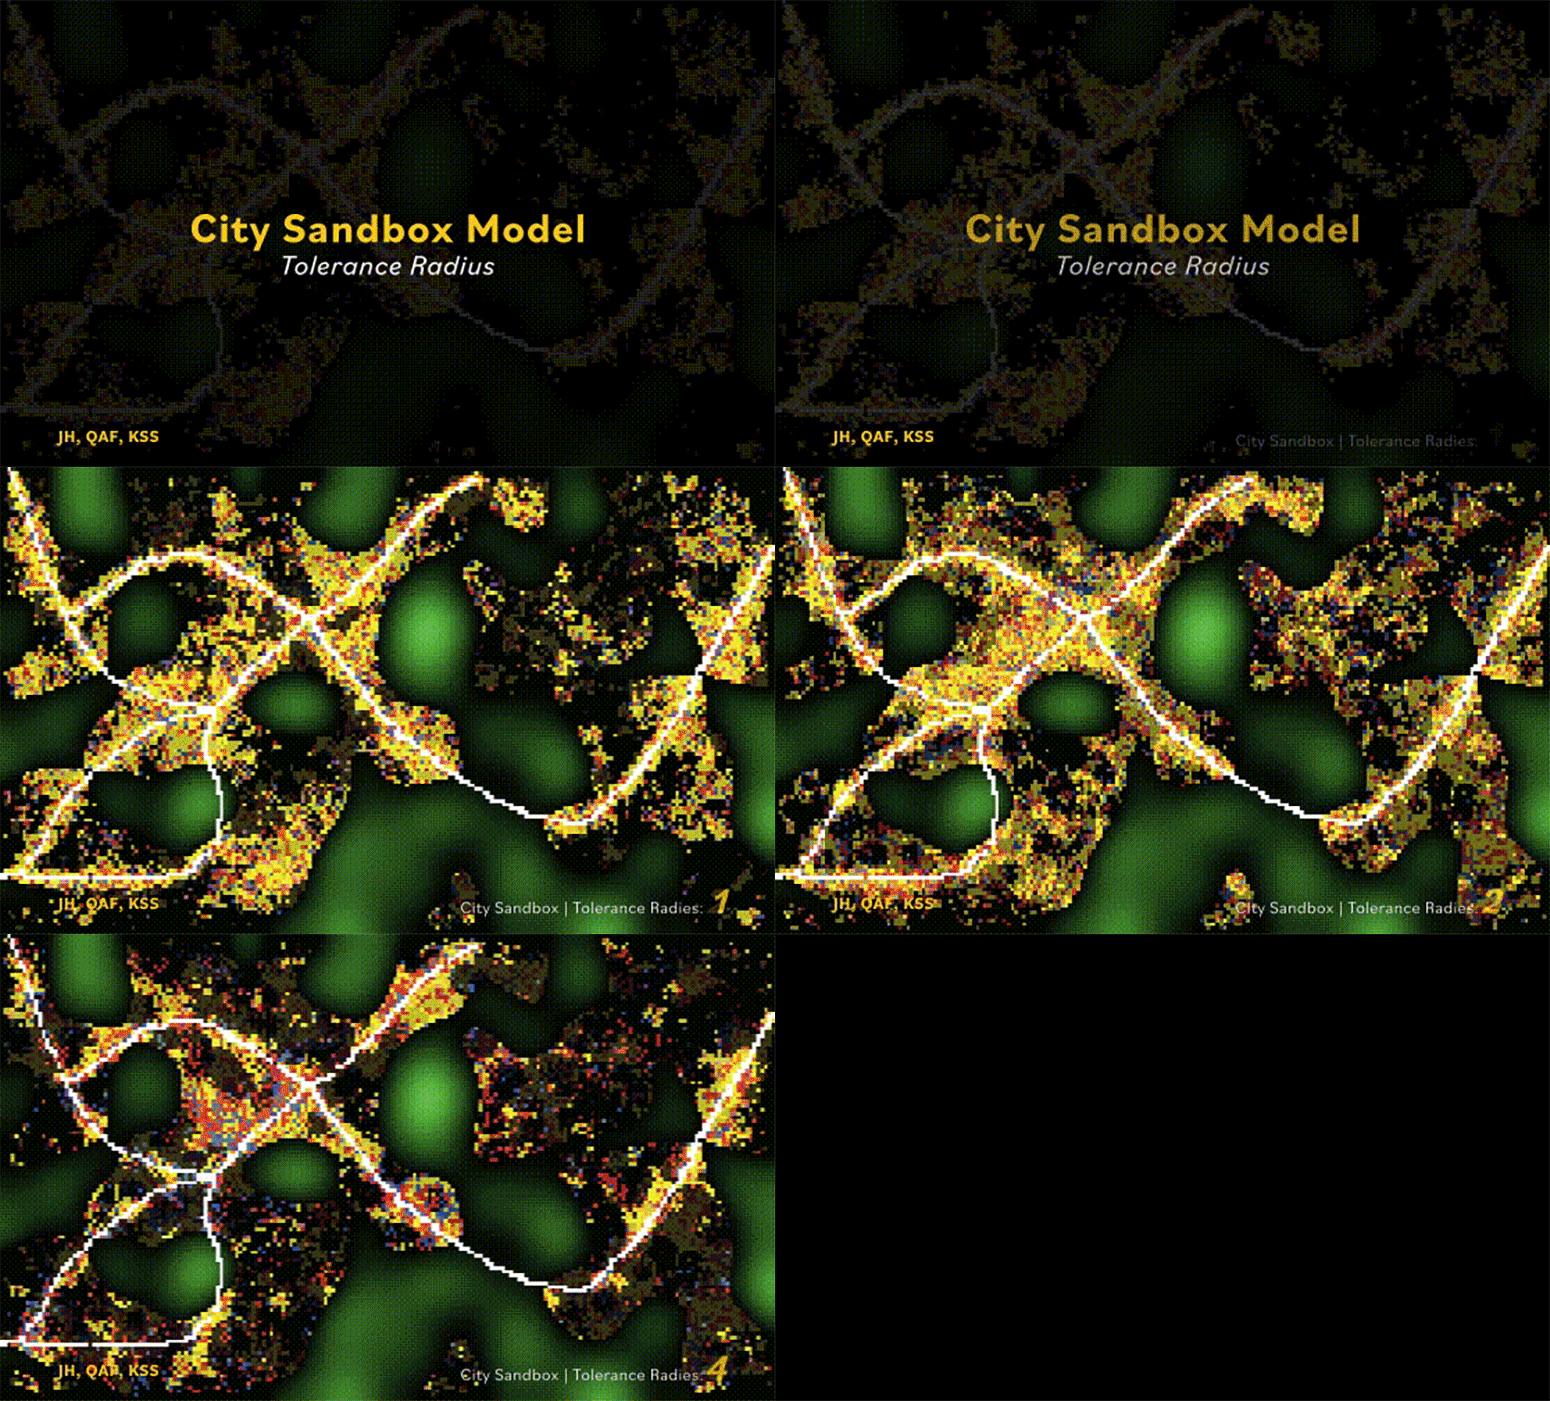
City Sandbox: Polarization of cities as tolerance decreases.
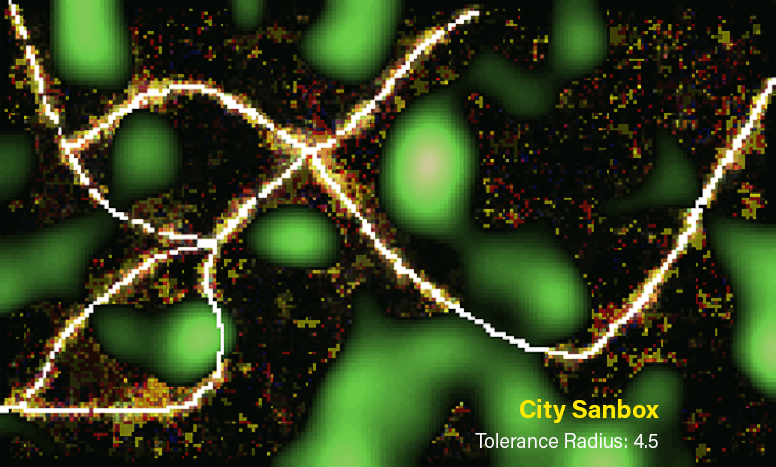
City Sandbox: Overlaid images of 8 simulations with TolRad of 4.5units.
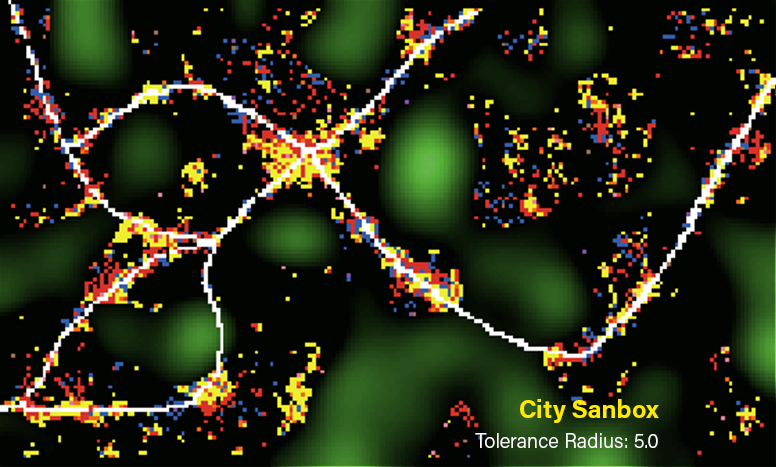
City Sandbox: Simulation with TolRad of 5 units. Notice how the city clusters are segregated rather than creating cities of similar use types adjacent to different a city of another type.
Spatial Modelling of Urban Growth
Agent Based modelling and simulation of Urban Growth from green-field sites
codecomputationspatial-modeling
In this project, we used agent-based modeling techniques to simulate city growth and analyze the effects of various design parameters on that growth. Netlogo was used as the modeling framework, and three different models were employed: Structure from Randomness 1 (SfR1), Structure from Randomness 2 (SfR2), and City Sandbox.
In SfR1, the potential distribution of a city was grown under identical simulation conditions in order to remove stochasticity from the results. In SfR2, a threshold for growth potential and discretization of the growth process were added to the simulation, simulating the way that humans might decide whether to buy a piece of land. In the City Sandbox model, different land use types and tolerance limits were added to more accurately reflect human behavior in city planning.
Image processing techniques were used to identify underlying patterns in the growth of the simulated cities, and the effects of various design parameters on that growth were analyzed. A number of interesting phenomena were observed, such as the way that cities can grow in unexpected ways, and the way that industrial areas often "win out" over residential areas in terms of growth and development when the tolerance of industrial buildings decreased.
While the City Sandbox model provides valuable insights into the growth and development of cities, modern cities may differ from the predictions of the model. For example, improvements in transportation technology and urban planning have made it possible for residential and industrial areas to coexist farther apart, and for people to travel easily between them. In addition, advances in environmental protection and sustainability have led to a greater emphasis on preserving natural areas and green space within cities. These and other factors may affect the growth and development of modern cities in ways that the City Sandbox model does not account for.
Overall, this project represents a valuable contribution to the field of spatial modeling, providing valuable insights into the way that cities grow and develop over time. The use of different modeling techniques and image processing techniques allowed for a deep understanding of the complex systems at work in urban environments, and the findings of the work could be valuable in informing future planning and development efforts.
GlassEye
Concept Design of an Assistive Technology for the blind
artassistive-techdesign
GlassEye is a design concept for a pair of glasses that aims to help people who are visually impaired or blind overcome their barriers to socialization and improve their quality of life. The glasses use a combination of advanced technologies, including facial recognition, time of flight sensors, and computer vision, to provide the user with a comprehensive view of their surroundings and detect potential hazards. In addition to these features, GlassEye also includes braille panels and an earpiece for communication, giving users multiple ways to receive information and interact with their environment.
In addition to the facial recognition feature, GlassEye also uses 3D time-of-flight sensors and computer vision to detect obstacles and potential hazards in the user's environment. They are located at the glasses' centre and provide a 3D view of the area in front of the user. This allows the user to be aware of any objects or obstacles in their path, helping them to navigate their environment more safely. The computer vision system can detect potential hazards, such as cars approaching from the side, and alert the user through the earpiece or braille panels.
The GlassEye gloves have a dynamic braille panel and can display messages in braille using piezoelectric or magnetic "pixels". These pixels can be activated in different combinations to represent braille characters, allowing the user to understand notifications through touch. The use of gloves enables users to receive information through a medium that is familiar and comfortable for them. The earpiece can also provide audio data to the user, allowing them to choose the most appropriate communication method based on the situation.
In conclusion, GlassEye is an assistive technology design concept that has the potential to significantly improve the quality of life for people who are visually impaired or blind. Its use of technologies combined with the flexibility of braille panels and an earpiece for communication makes it a unique and powerful tool for overcoming the barriers to socialization and independence faced by this population. While GlassEye is currently only a concept, its development and implementation could have a significant impact on the lives of people who are visually impaired or blind, helping them to fully participate in society and achieve their full potential.
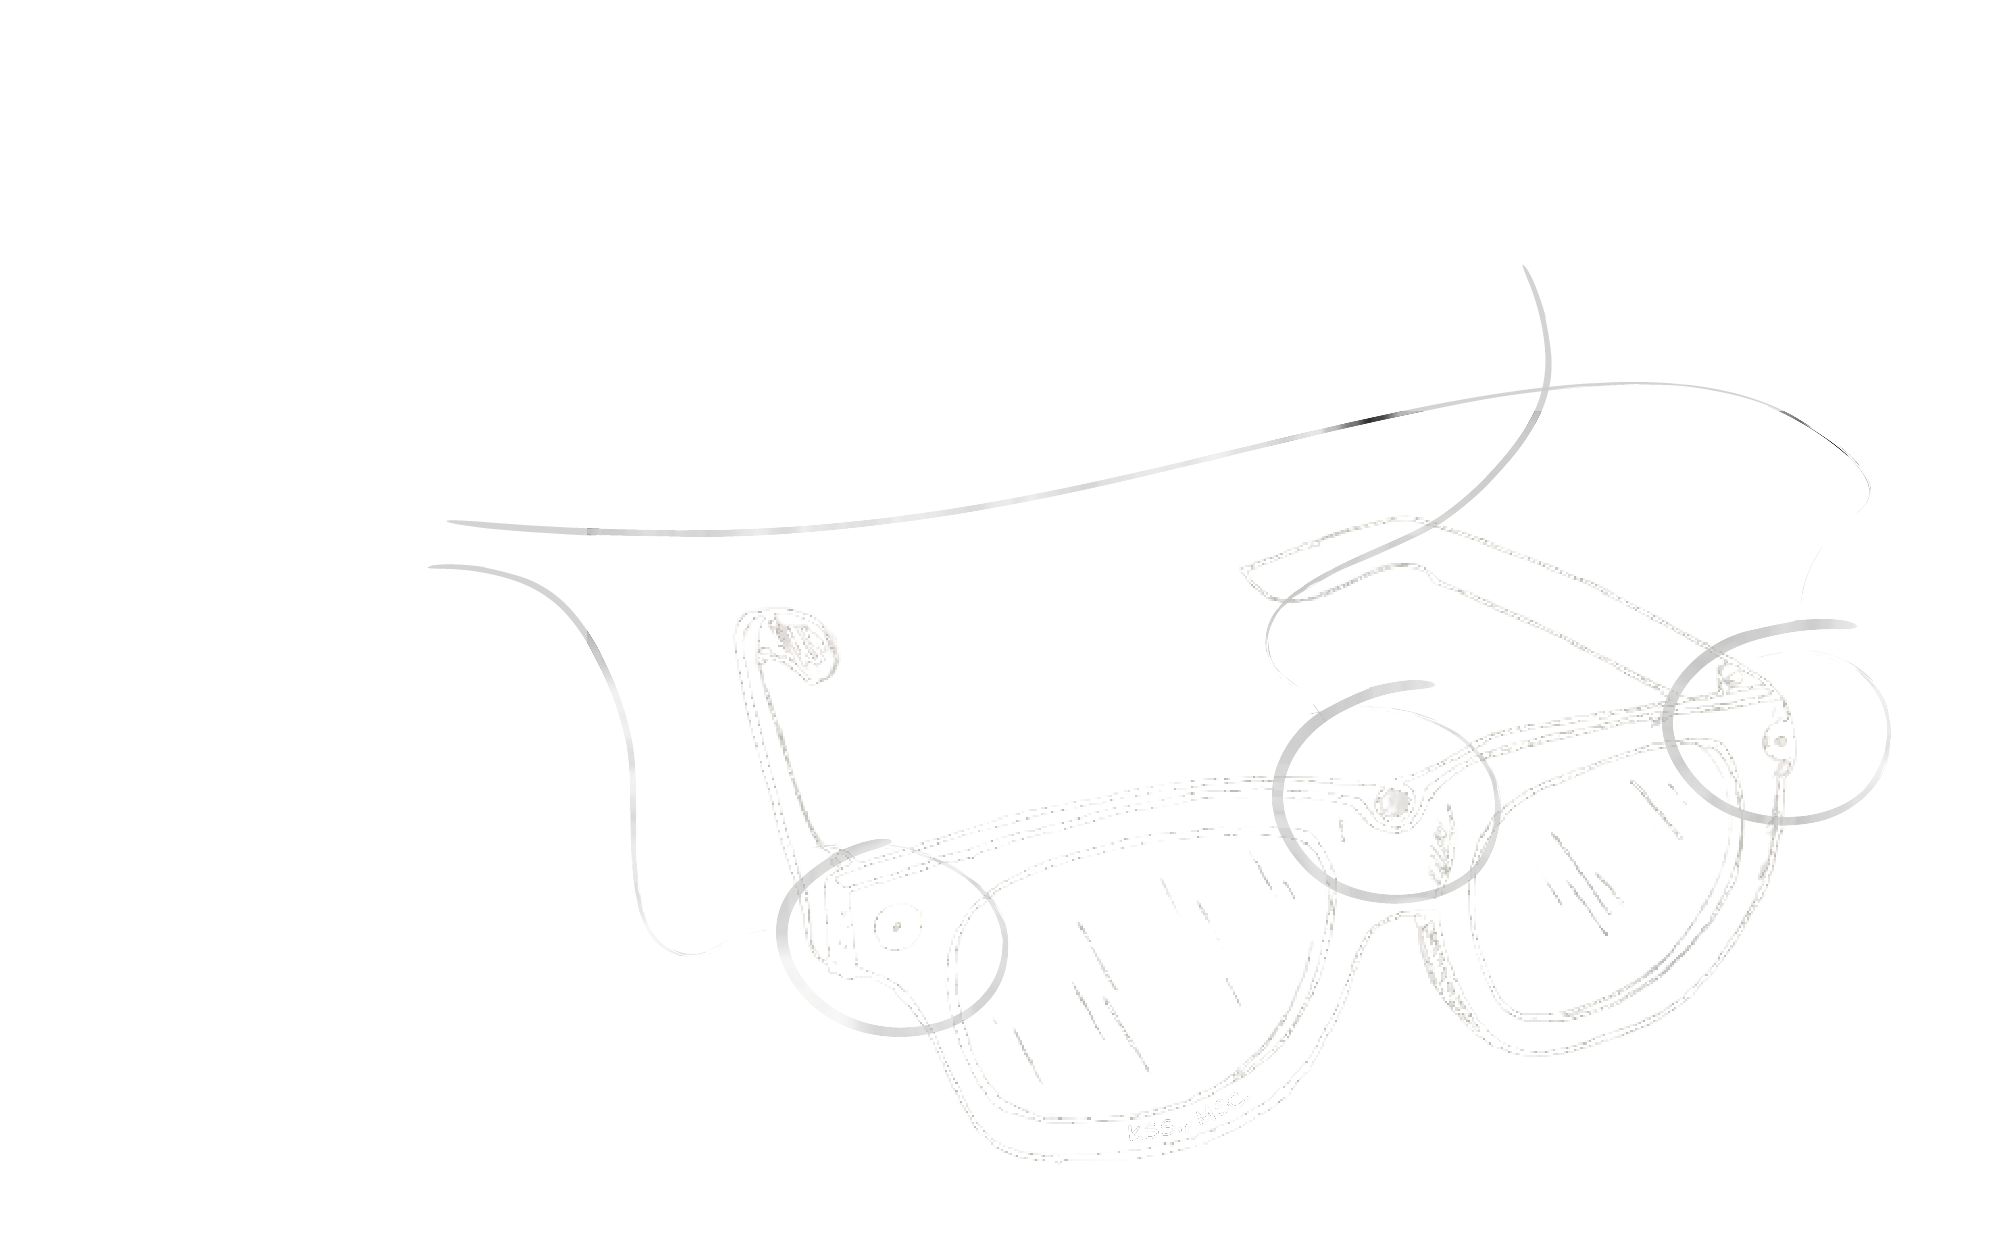
Diagram of glasses, with ToF sensor at the centre and wide angle cameras at either corners.
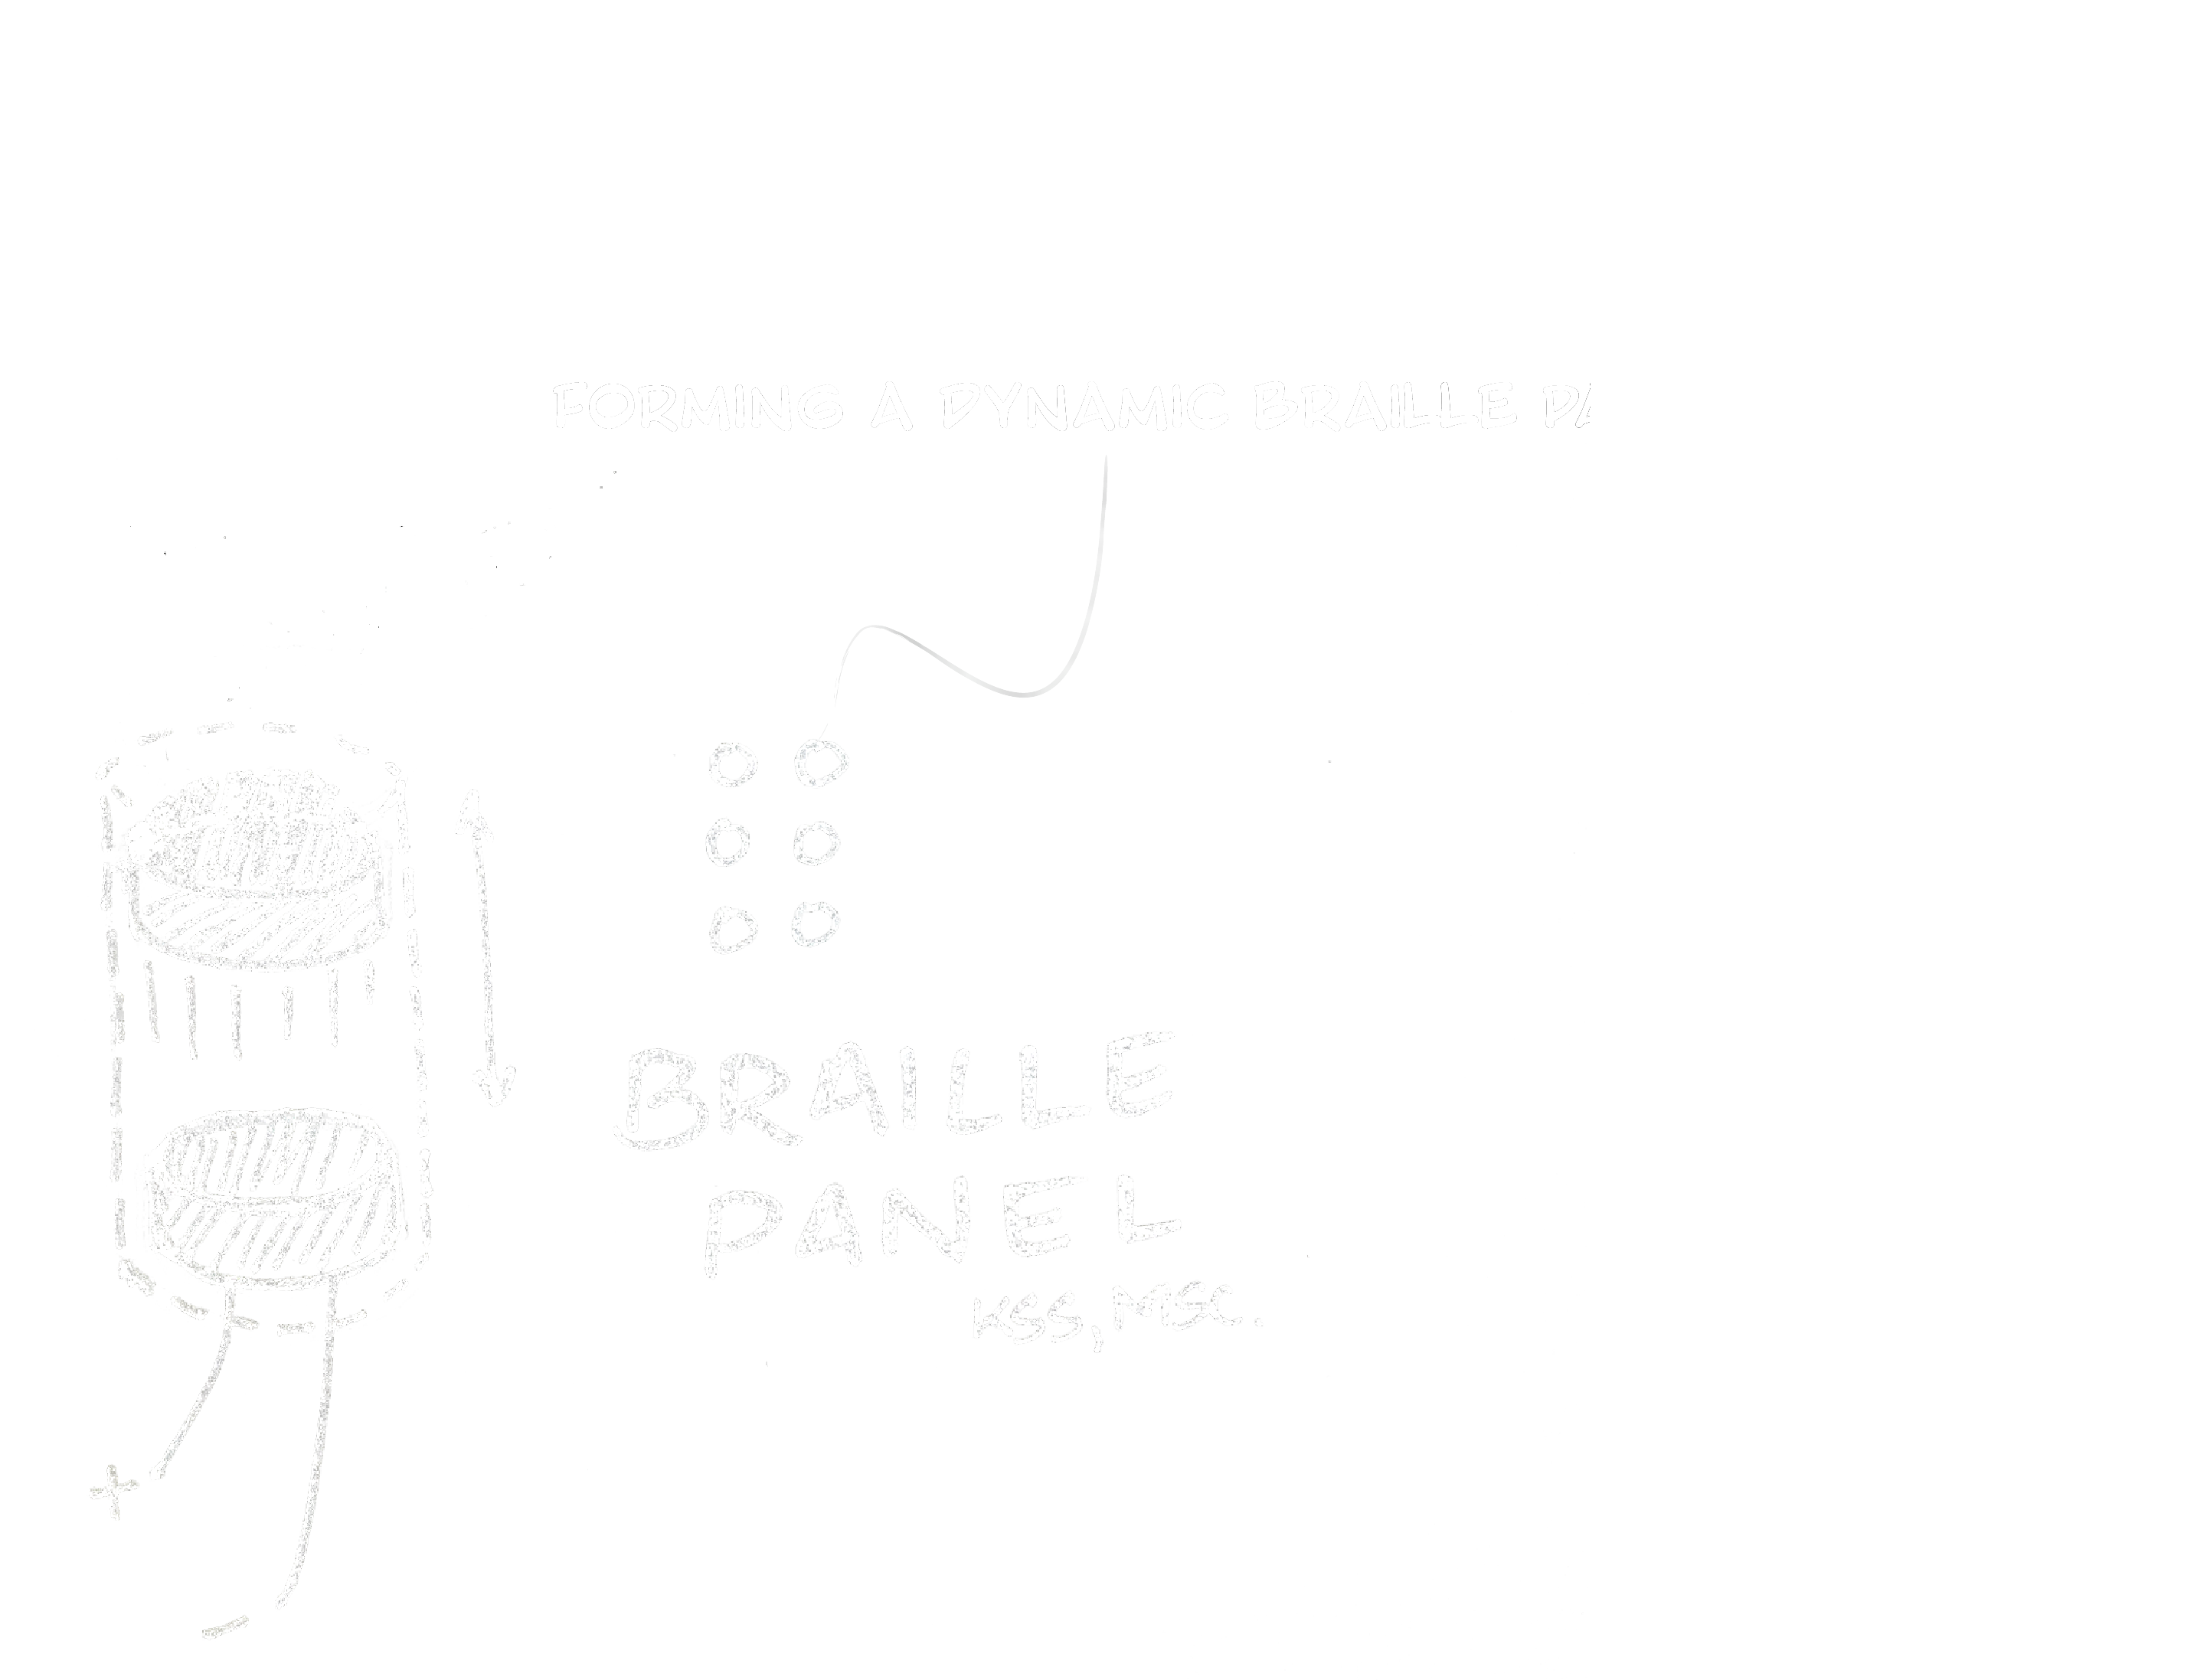
Dynamic braille pixel made using spring loaded electromagnet arrays.